
TL;DR:
- VaR estimates the maximum potential loss of an FX portfolio under normal market conditions.
- Historical simulation is favored for FX risk due to non-normal returns, despite data dependency.
- Limitations include tail risk blindness and assumptions of normal markets, requiring complementary stress tests.
Many international companies believe they have a handle on their currency exposure, until a sudden market move proves otherwise. The reality is that most financial models assume markets behave predictably, and that assumption is where losses hide. Value at Risk (VaR) estimates the maximum potential loss under normal conditions, giving you a statistical boundary for what your FX portfolio could lose over a set period at a given confidence level. This guide walks through how VaR works, how to calculate it, where it breaks down, and how regulatory frameworks use it so you can apply it with real precision.
Table of Contents
- Defining Value at Risk: Foundations and key concepts
- Methods for calculating VaR: Parametric, historical, and advanced approaches
- Limits and practical challenges: Liquidity, tail risk, and model pitfalls
- Regulatory landscape: VaR's role in capital requirements
- A fresh perspective: What most financial leaders miss about VaR
- Manage FX risk smarter with CorpHedge solutions
- Frequently asked questions
Key Takeaways
| Point | Details |
|---|---|
| VaR is foundational | Value at Risk is the standard approach for measuring potential portfolio loss under common market conditions. |
| Method choice matters | Historical or nonparametric methods are most effective for FX portfolios with non-normal risks. |
| VaR has limitations | VaR does not measure extreme losses, relies on market assumptions, and must be complemented with practical safeguards. |
| Regulatory shifts impact VaR | Basel standards use VaR for capital, but are moving to Expected Shortfall for enhanced tail risk coverage. |
| Backtesting is key | Regular backtesting is essential for ensuring VaR models are accurate and fit for real-world currency risk. |
Defining Value at Risk: Foundations and key concepts
At its core, VaR is a single number that answers a specific question: what is the worst loss my portfolio is likely to suffer over a defined period, assuming markets behave normally? VaR estimates the maximum loss of a portfolio at a given confidence level, typically 95% or 99%. If your one-day VaR at 99% confidence is $500,000, it means there is only a 1% chance of losing more than that amount in a single trading day under normal market conditions.
Two parameters define every VaR calculation:
- Time horizon: The period over which potential loss is measured, commonly one day for trading books or ten days for regulatory capital.
- Confidence level: How certain you want to be about the loss boundary, with 95% and 99% being the standard choices in FX risk management.
For companies managing risk analytics for currency exposure, VaR serves as a daily dashboard metric. It helps treasury teams set position limits, allocate hedging budgets, and communicate risk to senior leadership in a format that is easy to act on.
| Parameter | Common value | What it means |
|---|---|---|
| Confidence level | 95% or 99% | Probability the loss stays below VaR |
| Time horizon | 1 day or 10 days | Window for measuring potential loss |
| Portfolio scope | FX positions | Which exposures are included |
The core assumption in standard VaR is that returns follow a normal distribution, meaning extreme moves are rare and predictable. This works reasonably well in calm markets but creates blind spots during volatility spikes. Understanding this limitation is just as important as knowing the formula itself.
Pro Tip: Before running VaR on your FX book, map out which currency pairs drive the most volatility in your portfolio. Concentrating your model on high-impact pairs gives you a more actionable number than averaging across every position.
For a broader view of how VaR fits into risk management for global companies, it is worth thinking of it not as a prediction but as a structured way to quantify uncertainty. The number itself is less important than the discipline of measuring it consistently.
Methods for calculating VaR: Parametric, historical, and advanced approaches
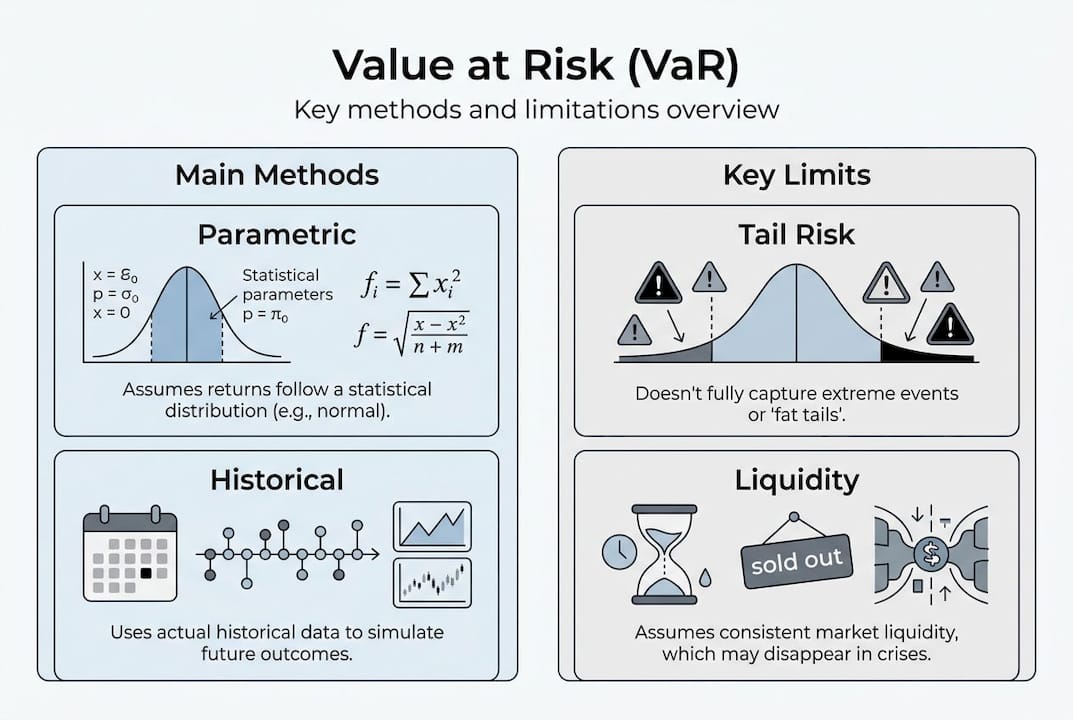
How you calculate VaR matters enormously, especially for FX portfolios where return distributions are rarely perfectly normal. There are three primary approaches, each with distinct trade-offs.
- Parametric method: Assumes returns are normally distributed and uses mean and standard deviation to calculate VaR. It is fast and simple but tends to underestimate losses during volatile periods because it ignores fat tails, the extreme moves that happen more often than a normal distribution predicts.
- Historical simulation: Uses actual past returns to construct the loss distribution. No normality assumption is required, which makes it better suited for FX portfolios where currencies regularly experience sharp moves. The drawback is that it depends entirely on the historical window you choose.
- Nonparametric decay methods: A newer class of approaches that weight recent observations more heavily, adapting faster to changing market conditions. Nonparametric decay methods outperform classical approaches by 97% in quantile loss for FX risk, making them a compelling upgrade for firms with the data infrastructure to support them.
"Empirical benchmarks show historical simulation works best for non-normal FX returns, while new decay and GARCH-t models outperform classical approaches for long-horizon FX portfolios." This finding has significant implications for how treasury teams should select their calculation engine.
| Method | Normality assumption | Best for | Key weakness |
|---|---|---|---|
| Parametric | Yes | Simple, fast calculations | Misses fat tails |
| Historical simulation | No | Non-normal FX returns | Depends on history window |
| Nonparametric decay | No | Adaptive, long-horizon FX | Requires more data infrastructure |
For most international companies, historical simulation strikes the best balance between accuracy and implementation cost. If you want to go deeper on the mechanics, the VaR workflow for FX walks through the step-by-step process in practical terms.

Choosing the right method is not a one-time decision. As your FX portfolio evolves and market regimes shift, your calculation approach should be reviewed regularly. Companies that lock into a single method without revisiting it often find their VaR numbers drifting away from reality. For context on broader market risk strategies, the method choice is just one layer of a well-structured risk framework.
Limits and practical challenges: Liquidity, tail risk, and model pitfalls
VaR is a powerful tool, but it comes with structural limitations that every financial decision-maker needs to understand before relying on it. VaR assumes normal markets and fails to measure losses beyond the threshold, meaning the worst-case scenarios that actually threaten solvency are precisely what VaR does not capture.
Here are the core limitations you need to manage:
- Tail risk blindness: VaR tells you the loss at the 99th percentile but says nothing about what happens in the remaining 1%. During currency crises, that 1% can be catastrophic.
- Liquidity risk: In stressed markets, you may not be able to exit FX positions at modeled prices. The bid-ask spread widens, counterparties pull back, and your actual loss exceeds the VaR estimate.
- Model risk: Small changes in parameter choices, like the historical window length or the confidence level, can produce meaningfully different VaR numbers. This creates a false sense of precision.
- Correlation breakdown: In normal markets, currency pairs move with predictable relationships. During stress events, those correlations collapse, making portfolio-level VaR estimates unreliable.
Pro Tip: Run stress tests alongside your VaR calculation. Pick three to five historical crisis scenarios, such as the 2015 Swiss franc shock or the 2022 yen depreciation, and see how your current portfolio would have performed. This gives you a reality check that VaR alone cannot provide.
Key stat: During the 2008 financial crisis, many institutions found their actual daily losses exceeded their 99% VaR estimates on multiple consecutive days, a statistical impossibility under the normality assumption but a practical reality under correlated stress.
Addressing these limitations means pairing VaR with complementary tools. Understanding the full range of key FX risk types helps you build a more complete picture. Combining VaR with Expected Shortfall (which averages losses beyond the threshold) and scenario analysis gives you a much stronger framework. For practical guidance on currency fluctuation best practices, layering these tools is the standard approach among sophisticated treasury teams.
Regulatory landscape: VaR's role in capital requirements
VaR is not just an internal risk tool. It sits at the center of how regulators require banks and financial institutions to hold capital against market risk, and that has direct implications for the companies that work with them.
Under Basel II and Basel III, VaR became the standard measure for calculating market risk capital requirements. Banks must hold a capital buffer based on their VaR estimates, with a multiplier applied depending on how well their models perform in backtesting. The logic is straightforward: a bank with a more accurate VaR model is rewarded with a lower capital multiplier.
| Framework | Risk measure | Capital multiplier | Tail risk approach |
|---|---|---|---|
| Basel II | VaR (99%, 10-day) | 3x to 4x based on backtesting | Limited |
| Basel III | VaR plus stressed VaR | 3x to 4x | Improved |
| FRTB | Expected Shortfall | Varies by desk | Full tail coverage |
The Fundamental Review of the Trading Book (FRTB) marks a significant shift. Basel II/III uses VaR for market risk capital, but Expected Shortfall is replacing VaR for tail risks under FRTB, with structural FX hedging exemptions available for qualifying positions.
For corporate treasurers, the structural FX exemption is particularly relevant. Positions held to hedge the currency risk of a bank's own capital ratios can be excluded from market risk capital calculations under specific conditions. This creates planning opportunities for companies structuring their FX hedges through banking partners.
The practical steps for staying aligned with regulatory expectations include:
- Confirm which regulatory framework applies to your banking counterparties and how it affects pricing on hedging instruments.
- Implement continuous backtesting so your VaR model's exception rate stays within acceptable bounds.
- Review whether your FX positions qualify for structural exemptions under FRTB rules.
- Align internal VaR reporting with the confidence levels and time horizons used by your regulatory counterparties.
For companies managing currency risk governance at a strategic level, understanding the regulatory layer helps you negotiate better terms and structure hedges more efficiently.
A fresh perspective: What most financial leaders miss about VaR
Most treasury teams treat VaR as a compliance checkbox. They run the model, report the number, and move on. That is a costly mistake. The real value of VaR comes from what happens after you calculate it: backtesting, exception tracking, and model refinement.
Backtesting traffic lights guide capital multipliers based on exception rates, with green, yellow, and red zones that signal whether your model is performing as expected. A model sitting in the yellow zone is not just a regulatory concern. It is a signal that your VaR is systematically underestimating risk, and your hedging decisions are being made on flawed data.
The uncomfortable truth is that standard VaR models often understate true FX risk precisely because the normality assumption feels safe. Markets are not normal. Currency pairs experience regime changes, political shocks, and liquidity events that no bell curve captures. The companies that manage FX risk most effectively are the ones that treat VaR as a living model, not a static output. They update their currency risk governance insights regularly, track exceptions with discipline, and favor adaptive frameworks over legacy parametric models.
Manage FX risk smarter with CorpHedge solutions
Applying VaR effectively in a real FX portfolio requires more than a formula. It requires the right infrastructure to calculate, monitor, and act on risk signals in real time. CorpHedge is built specifically for financial decision-makers who need accurate VaR calculation, live FX position visibility, and strategy execution in one place.
Whether you are refining your calculation methodology, aligning with regulatory requirements, or building a more adaptive hedging strategy, CorpHedge gives you the tools to do it with confidence. Explore the features overview to see how the platform handles VaR-based strategy execution, or take the interactive demo tour to see it in action. For a structured walkthrough of how it fits your specific needs, the risk management product tour is a great starting point.
Frequently asked questions
How is value at risk calculated for currency portfolios?
VaR for currencies is typically calculated using parametric, historical, or nonparametric methods depending on the portfolio's returns distribution and available data. Historical simulation often provides the best results for non-normal FX returns.
What are the main limitations of VaR?
VaR fails to capture losses beyond the threshold, assumes normal markets, and is sensitive to liquidity, correlations, and model risks. VaR's limitations include tail risk blindness and market assumption errors that become critical during stress events.
How does VaR connect to regulatory capital requirements?
Banks use VaR for market risk capital under Basel II/III, but Expected Shortfall is preferred for tail risks in FRTB. Basel II/III requires VaR for capital, with ES replacing it for tail risk under the newer framework.
What is backtesting in VaR, and why is it important?
Backtesting checks whether actual losses exceed the predicted VaR and flags model errors or exceptions that affect compliance and capital levels. Backtesting traffic lights in green, yellow, and red zones guide capital multipliers based on how often exceptions occur.
Which VaR method is best for FX risk management?
For non-normal FX returns, historical simulation or nonparametric decay methods are generally more accurate than parametric approaches. Nonparametric decay approaches outperform classical methods for FX horizon risk by a significant margin.
Recommended
- Master the role of risk analytics in currency risk management
- Streamline your Value at Risk workflow for FX risk
- Enterprise currency risk management: Strategies to maximize profitability
- Top risk management best practices to mitigate currency fluctuations
- Crypto risk management rules: Strategies for retail traders – DayProp Funding
- Principais riscos no forex: proteja seus investimentos