
A single unexpected currency swing can erase millions from a multinational's quarterly earnings before the treasury team even opens their morning dashboard. That is not a hypothetical. For international corporations carrying significant cross-border exposures, unmanaged FX risk is a direct threat to profitability and cash flow predictability. Value at Risk is a core metric for measuring potential losses in FX portfolios, but the real power comes from embedding it into a repeatable, auditable workflow. This article walks you through exactly that: a structured, step-by-step approach to VaR calculation that satisfies board governance requirements and gives your risk team a defensible, scalable process.
Table of Contents
- What is Value at Risk and why does workflow matter?
- Essential tools and data for a robust VaR calculation workflow
- A step-by-step workflow for calculating Value at Risk
- Backtesting and verifying your VaR results
- Limitations of VaR and best practices for currency risk control
- Automate and optimize your VaR workflow with CorpHedge
- Frequently asked questions
Key Takeaways
| Point | Details |
|---|---|
| Workflow is crucial | A repeatable, validated workflow ensures VaR accuracy and compliance for FX portfolios. |
| Data and methods matter | Select the right calculation method and maintain high-quality inputs for reliable results. |
| Continuous backtesting | Rigorous backtesting validates your VaR and keeps risk management aligned with market realities. |
| Understand VaR limits | Always complement VaR with stress testing and analytics for robust currency risk control. |
What is Value at Risk and why does workflow matter?
Value at Risk (VaR) answers one specific question: given normal market conditions, what is the maximum loss your portfolio could suffer over a defined time horizon at a given confidence level? For a CFO or treasury director, that number is not just a risk metric. It is a governance artifact, a regulatory input, and a strategic decision tool all at once.
The problem is that many organizations treat VaR as a one-off calculation rather than a living process. A number produced once a quarter, dropped into a board deck, tells you almost nothing about how your exposure is shifting week to week. Regulators and audit committees increasingly demand evidence of a repeatable workflow, not just an output. That means documented data sources, consistent methodology, and traceable exception handling.
Risk analytics in currency risk management has matured significantly, and the expectation is now that VaR is calculated, monitored, and backtested on a continuous basis. According to industry surveys, 92% of corporations use VaR for FX risk monitoring, which means your counterparties, lenders, and regulators are already fluent in this language.
The three core VaR methodologies are:
- Parametric (Variance-Covariance): Assumes returns follow a normal distribution. Fast and simple, but less reliable for portfolios with options or skewed FX distributions.
- Historical Simulation: Uses actual past return data to rank losses. No distribution assumption required, but heavily dependent on the quality and length of your historical dataset.
- Monte Carlo Simulation: Generates thousands of hypothetical scenarios using statistical models. The most flexible approach, especially for three primary methodologies involving complex derivatives or multi-currency books.
Each method has a place in a mature FX risk program. The workflow you build should specify which method applies to which portfolio segment and why.
Essential tools and data for a robust VaR calculation workflow
Before you run a single calculation, the quality of your inputs determines the reliability of your output. Garbage in, garbage out is especially punishing in risk management, where a flawed VaR number can create false confidence at exactly the wrong moment.

A sound VaR workflow starts with data collection, specifically historical prices and returns for every currency pair in your portfolio. The data source matters enormously. Central bank feeds, Bloomberg, or Refinitiv are preferable to aggregated retail FX sources, which can carry bid-ask distortions that inflate apparent volatility.
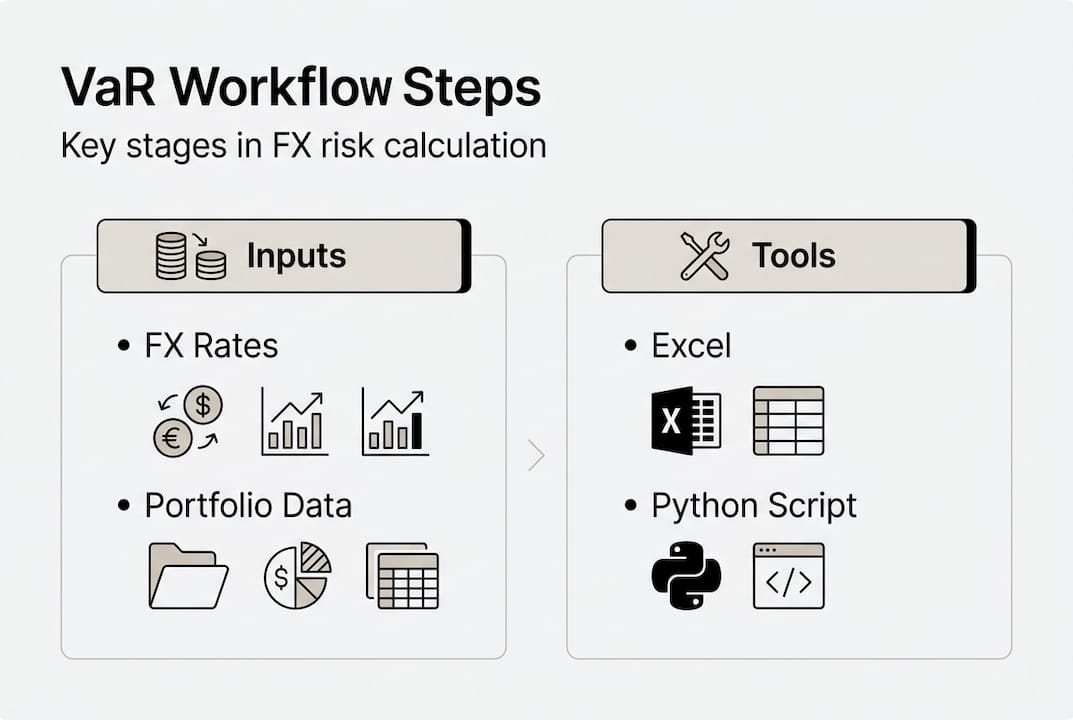
Core inputs your workflow must include:
- Daily historical FX rates for all relevant currency pairs (minimum 250 trading days, ideally 500 or more)
- Portfolio composition: notional values, transaction weights, and current market value by currency
- Correlation matrix across currency pairs, updated at least monthly
- Volatility estimates, either rolling historical or GARCH-modeled for more dynamic environments
- Instrument-level data for any FX derivatives (forwards, options, swaps)
Recommended tools by use case:
| Use case | Tool options | Notes |
|---|---|---|
| Small portfolios, quick analysis | Excel with MarketXLS | Good for parametric and historical methods |
| Statistical modeling | R or Python (pandas, scipy) | Best for Monte Carlo and custom models |
| Enterprise FX risk management | Specialized platforms (e.g., CorpHedge) | Real-time data, automation, audit trails |
| Data validation | SQL or Power Query | Essential for cleaning raw FX feeds |
For teams managing best practices to mitigate currency fluctuations, automating the return calculation step from raw daily rates is a significant time saver and reduces manual error. Similarly, integrating your VaR tool with your accounting service for currency risk ensures your risk numbers and your financial statements are always speaking the same language.
Pro Tip: Set up an automated script (Python or Excel macro) that pulls daily FX closing rates, calculates log returns, and flags any data gaps or outliers before they enter your VaR model. This single step eliminates the most common source of calculation errors.
A step-by-step workflow for calculating Value at Risk
With your data and tools ready, here is the workflow you can embed directly into your FX risk playbook.
- Collect and validate data. Pull historical daily FX rates for all portfolio currency pairs. Check for missing values, outliers, and corporate actions. Calculate log returns: ln(P_t / P_{t-1}).
- Select your methodology. Use parametric for simple linear exposures. Use historical simulation for portfolios without heavy derivatives. Use Monte Carlo for complex books with options or non-linear payoffs.
- Run the calculation.
- Parametric example: For a $100,000 portfolio with 1.35% daily volatility, the 95% daily VaR equals $1,974. Formula: VaR = Portfolio Value x Volatility x Z-score (1.645 for 95%).
- Historical simulation example: For a $1 million EUR/USD position, sort 500 days of returns, find the 1st percentile loss. The 99% historical VaR equals $17,000 in this scenario.
- Monte Carlo: Simulate 10,000 or more return paths using your estimated volatility and correlation inputs. The VaR is the loss at your chosen percentile across all simulated outcomes.
- Aggregate across the portfolio. Sum individual position VaRs, then apply the correlation matrix to get diversified portfolio VaR. Ignoring correlations overstates risk in diversified books.
- Scale for your time horizon. Daily VaR scales to a 10-day horizon by multiplying by the square root of 10. This is the standard Basel III horizon for market risk capital.
For risk reduction for currency exposure in multi-currency portfolios, Monte Carlo or historical simulation handle non-normal volatilities far better than parametric methods, especially during periods of elevated FX stress. When mitigating corporate FX risk, method selection is not a one-time decision. Revisit it whenever your portfolio composition changes materially.
Comparison of VaR methodologies:
| Method | Speed | Key assumption | Best use case |
|---|---|---|---|
| Parametric | Fast | Normal return distribution | Simple linear FX positions |
| Historical simulation | Moderate | Past returns repeat | Portfolios without heavy derivatives |
| Monte Carlo | Slow | Model-dependent scenarios | Complex books, FX options, non-linear risk |
Pro Tip: For multi-currency portfolios, always check your FX correlation matrix for shifting relationships. Correlations that held during calm markets can break down sharply during stress events, and a stale matrix will understate your true portfolio VaR.
Backtesting and verifying your VaR results
Calculating VaR is only half the job. The other half is proving it works. Backtesting compares your predicted VaR threshold against actual daily profit and loss (P&L) outcomes. Every day your actual loss exceeds the VaR estimate counts as an exception.
Backtesting compares predicted VaR to actual P&L, and Basel III uses exception frequency over 250 trading days to classify your model's reliability into three zones:
| Basel III zone | Exceptions per 250 days | Implication |
|---|---|---|
| Green | 0 to 4 | Model is acceptable |
| Yellow | 5 to 9 | Model under scrutiny; review required |
| Red | 10 or more | Model rejected; capital add-on applied |
If your model lands in the yellow or red zone, the workflow response is not to simply recalibrate the confidence level. You need to investigate whether your volatility estimates are stale, your correlation assumptions have shifted, or your data has gaps.
"Only rigorous backtesting can give executives confidence their VaR is fit-for-purpose."
Best practices for backtesting and workflow improvement:
- Run backtests on a rolling 250-day window, updated daily
- Log every exception with the date, currency pair, and magnitude of the breach
- Escalate yellow-zone results to the risk committee within five business days
- Review your volatility model and correlation matrix whenever you record three or more exceptions in a single month
- Use the Kupiec POF (Proportion of Failures) test for a formal statistical assessment of model accuracy
For teams using FX exposure management features, automated exception tracking removes the manual burden and ensures nothing slips through during high-volume trading periods. You can also review VaR backtesting examples to benchmark your exception rates against realistic portfolio scenarios.
Limitations of VaR and best practices for currency risk control
A sound workflow is essential, but you need to know exactly where VaR can mislead you. The 2008 financial crisis and the 2015 Swiss franc shock are two well-documented cases where VaR models across major institutions dramatically underestimated actual losses. Understanding why is not academic. It is operationally critical.
VaR does not capture tail loss severity, is not subadditive in all cases, and fails systematically during crisis periods when correlations spike and distributions become fat-tailed. A 99% VaR tells you nothing about how bad the 1% scenario actually gets.
Situations where VaR can produce false security:
- When FX return distributions are skewed or have fat tails (common in emerging market currencies)
- When correlation assumptions are based on calm-period data and do not reflect stress regimes
- When the historical window is too short to capture a full market cycle
- When options or non-linear instruments are approximated rather than fully modeled
- When VaR is reported without any complementary stress test or scenario analysis
The role of risk analytics in a mature FX program goes well beyond VaR. Conditional Value at Risk (CVaR), also called Expected Shortfall, measures the average loss in the tail beyond the VaR threshold. It is a more conservative and informative metric for extreme scenarios.
Pro Tip: Always supplement your VaR with at least two scenario analyses per quarter: one based on a historical stress event (e.g., a 15% EUR/USD move in five days) and one forward-looking scenario based on current geopolitical or macro risks. This combination gives your board a far more complete picture than VaR alone.
Best practice checklist for currency risk control beyond VaR:
- Complement VaR with CVaR and scenario analysis every reporting cycle
- Review and update correlation assumptions at least monthly
- Automate exception reporting so breaches trigger immediate alerts
- Stress-test your portfolio against at least three historical crisis scenarios annually
- Document all model assumptions and review them when market regimes change
Automate and optimize your VaR workflow with CorpHedge
For executives ready to move from manual workflows to streamlined automation, CorpHedge is built specifically for this transition. Managing a multi-currency VaR workflow manually across spreadsheets introduces version control risks, calculation errors, and audit gaps that no risk committee should accept.
CorpHedge automates portfolio uploads, calculates real-time VaR across your FX positions, and delivers exception monitoring with full audit trails. The platform supports regulatory reporting requirements and integrates with existing treasury systems, so your risk data and financial records stay aligned. Explore the full features for FX risk to see how the platform handles everything from data ingestion to backtesting dashboards. Take a product tour to see the workflow in action, or book a demo tour for a personalized walkthrough tailored to your portfolio's complexity. Your VaR workflow should be an asset, not a liability.
Frequently asked questions
What is the difference between parametric, historical, and Monte Carlo VaR?
Parametric assumes normal returns, historical simulation sorts actual past returns to find the loss threshold, and Monte Carlo generates thousands of simulated future scenarios to estimate potential losses. Each method suits different portfolio types and risk environments.
How often should VaR be recalculated for currency portfolios?
VaR should be recalculated daily for active FX exposures, and monitor breaches daily while scaling time horizons carefully. Recalculate immediately whenever portfolio composition or market volatility shifts materially.
What is a VaR exception and how is it handled?
A VaR exception occurs when actual losses exceed the predicted VaR threshold for that day. Under Basel III exception zones, exceptions are tracked over 250 trading days and trigger model review or capital add-ons depending on frequency.
Why is VaR alone not enough for currency risk management?
VaR does not measure tail loss severity beyond the confidence threshold and breaks down during crisis periods when correlations spike. Supplement it with stress testing, scenario analysis, and CVaR for a complete risk picture.