

Six forecasting families cover the practical range of currency prediction techniques: fundamental, time-series/econometric, market-based, technical, machine learning, and ensemble methods. For most corporate treasury teams, the currency forecast methods list breaks down cleanly by horizon:
- Short horizon (1 day to 4 weeks): market-based signals (forward rates, option-implied volatility) and technical indicators
- Medium horizon (1–12 months): econometric models (ARIMA, VAR/VECM), HAR volatility models, and fundamental signals
- Long horizon (1 year+): structural/fundamental models (PPP, relative economic strength, DSGE-style) and ensemble combinations
Pro Tip: Start with a forward-implied rate as your baseline market signal, layer one causal econometric model (VAR or a simple OLS with macro factors), and run a rolling backtest before committing to any hedge ratio. That three-step routine catches most of the value without requiring a data science team.
Treasury teams managing CZK/EUR, HUF/EUR, PLN/EUR, or RON/EUR exposures should combine a market-based signal with one structural or econometric model and a backtest routine before acting on any forecast.
Key Takeaways
Combining a market-based signal with one causal econometric model and a rolling backtest routine covers most of the practical value in corporate currency forecasting without requiring a data science team.
| Point | Details |
|---|---|
| Match method to horizon | Use forward rates and technical signals for short horizons; VAR/VECM and fundamental models for medium to long horizons. |
| Local factors matter for CE currencies | PCA plus linear regression using local GDP and CPI outperformed a random walk for PLN, HUF, CZK, and RON at 1-month to 1-year horizons. |
| HAR models for volatility | Univariate HAR frequently beats random-walk benchmarks for one-day-ahead volatility on CE currency pairs. |
| Always backtest against a random walk | A model that cannot beat a random walk out-of-sample is not ready for operational use; use rolling-origin evaluation with MSFE and MAFE. |
| Corphedge for CE currency teams | Corphedge consolidates VaR-based hedging simulation, live market data, and position tracking for CZK, HUF, PLN, and RON exposures in one platform. |
Table of Contents
- What's in the currency forecast methods list?
- How do fundamental forecasting methods work?
- Time-series and econometric models: what works for CE currencies?
- How do market-based forecasting signals work?
- When do technical methods add value for FX timing?
- Machine learning approaches: where do they fit in corporate FX forecasting?
- How to combine forecasts and evaluate their performance
- What does research say about forecasting Central European currencies?
- How to choose the right forecasting method for your organization
- Practical steps to operationalize your forecasting workflow
- What practitioners actually get wrong about currency forecasting
- Corphedge consolidates forecasting and hedging in one platform
- Sources
- FAQ
What's in the currency forecast methods list?
The table below catalogs each method family with its representative models, typical horizon, data frequency, interpretability, and resource level. This is the working catalog practitioners use to shortlist approaches before going deeper.
| Method | Representative Models | Typical Horizon | Data Frequency | Interpretability | Resource Level |
|---|---|---|---|---|---|
| Fundamental | PPP, relative economic strength, macro/DSGE | Medium to long | Monthly/quarterly | High | Medium |
| Time-series | ARIMA, ARIMAX, VAR, VECM | Short to medium | Daily/weekly/monthly | Medium | Medium |
| Volatility | GARCH, HAR, GHAR | Short (1-day ahead) | Daily/intraday | Medium | Medium |
| Market-based | Forward rates, covered/uncovered interest parity, option-implied vol | Short to medium | Daily | High | Low |
| Technical | SMA/EMA crossover, MACD, RSI, Bollinger Bands, momentum | Very short | Intraday/daily | High | Low |
| Machine learning | LSTM, RNN, random forest, XGBoost, hybrid ML-econometric | Short to medium | Daily/high-frequency | Low | High |
| Ensemble | Arithmetic mean, trimmed mean, model-weighted averaging | Any | Matches constituent models | Medium | Low to medium |
Key definitions:
- PPP (Purchasing Power Parity): exchange rate should equalize price levels across countries; produces long-run fair-value estimates
- Relative economic strength: uses growth, inflation, and interest-rate differentials to signal currency direction
- ARIMA/ARIMAX: autoregressive integrated moving average models; ARIMAX adds exogenous regressors
- VAR/VECM: vector autoregression and its error-correction variant for cointegrated series
- GARCH: generalized autoregressive conditional heteroskedasticity; models time-varying variance
- HAR: heterogeneous autoregressive model; uses realized variance at multiple lags (daily, weekly, monthly)
- Forward-implied: market-derived expected rate from forward contracts
- Option-implied volatility: market's expectation of future realized volatility extracted from option prices
- LSTM: long short-term memory neural network; captures long-range sequence dependencies
- Random forest / XGBoost: tree-ensemble methods that handle nonlinear feature interactions
How do fundamental forecasting methods work?
Fundamental methods anchor forecasts in economic theory. They are the right tool when you need a directional view over a 6-month to multi-year horizon and can tolerate imprecision at shorter intervals.
Purchasing Power Parity is the simplest structural anchor. PPP says the exchange rate should, over time, equalize the price of a basket of goods across two economies. In practice, CZK/EUR or PLN/EUR can deviate from PPP for years, so PPP is most useful as a fair-value reference rather than a timing signal. When the spot rate is notably below PPP fair value, that is a meaningful long-run reversion signal for a hedging policy review, not a trigger for a next-week trade.
Relative economic strength is more operationally useful at medium horizons. The logic: faster growth, lower inflation, and higher real interest rates attract capital and support the currency. For Central European currencies, the practical indicators to monitor are:
- Real GDP growth differential vs. the eurozone
- CPI and core inflation relative to ECB targets
- Central bank policy rate and real rate differential (CNB, NBP, MNB, NBR)
- Current account balance as a share of GDP
- Credit rating trajectory and sovereign spread
Structural/DSGE-style models are the domain of central banks and large institutions. The Czech National Bank's g3+ model upgrade illustrates what this looks like in practice: the 2025 revision added U.S. short-term rates to the uncovered interest parity condition, incorporated longer-term domestic rates, introduced time-varying steady-state appreciation, and applied an asymmetric treatment of unconventional ECB policy. That level of engineering is beyond most corporate teams, but the model's structure tells you which macro variables matter for CZK.
Pros and cons of fundamental methods:
- Pro: theoretically grounded, high interpretability, useful for board-level narrative
- Pro: works well for long-horizon policy setting (natural hedge decisions, pricing strategy)
- Con: poor short-term timing; PPP deviations can persist for years
- Con: requires consistent macro data; revisions can shift signals retroactively
For PLN/EUR, the NBP rate cycle and Poland's current account position have been the dominant fundamental drivers. For HUF/EUR, MNB policy credibility and Hungary's external financing needs carry extra weight.
Time-series and econometric models: what works for CE currencies?
Statistical models extract patterns from historical price and macro data without requiring a full structural theory. They are the workhorse of medium-horizon corporate forecasting.
Univariate models: ARIMA and ARIMAX
ARIMA fits autoregressive and moving-average components to a stationary series. For exchange rates, a standard ARIMA(1,1,1) on log-differenced spot rates is a reasonable baseline. ARIMAX extends this by adding exogenous regressors, such as interest rate differentials or trade balance surprises, which can improve accuracy at 1–3 month horizons. Practical ARIMA implementation follows a standard Box-Jenkins workflow: identify order via ACF/PACF, estimate, diagnose residuals, and forecast.
Multivariate models: VAR and VECM
VAR models treat multiple series (spot rate, interest rate differential, inflation spread) as jointly determined. When two series share a long-run equilibrium, the VECM adds an error-correction term that pulls the system back toward that equilibrium. For CZK/EUR, a minimal VAR setup might include:
- Log-differenced CZK/EUR spot rate
- CZK-EUR 3-month interest rate differential
- Czech-eurozone CPI differential
- Czech current account balance (monthly)
VECM outperforms a plain VAR when the series are cointegrated, which is often the case for CE currency pairs with stable long-run macro anchors. The practical pitfall: over-parameterization. A VAR with too many lags and variables will fit the in-sample data beautifully and fail out-of-sample. Keep it parsimonious.
Volatility models: GARCH and HAR
GARCH models time-varying variance, which is critical for option pricing, VaR calculation, and hedging cost estimation. HAR (Heterogeneous Autoregressive) models use realized variance at daily, weekly, and monthly lags. Research on CE currency volatility shows that univariate HAR models frequently outperform random-walk benchmarks for one-day-ahead volatility forecasting on CZK, HUF, PLN, and RON. Generalized HAR (GHAR) and multivariate HAR variants can further exploit cross-market linkages when CE currencies move together.
Data requirements checklist:
- Daily spot rates: minimum 3–5 years for ARIMA; 5–10 years for VAR/VECM
- Macro series (monthly): interest rates, CPI, current account, GDP growth
- Realized variance (daily): computed from intraday tick data or 5-minute returns for HAR
- Backtest window: hold out at least 20% of the sample for out-of-sample evaluation
How do market-based forecasting signals work?
Market prices aggregate the expectations of thousands of participants. For operational forecasting, that is a hard signal to beat at short horizons.
Forward rates are the most direct market-implied forecast. The forward premium or discount on CZK/EUR, for instance, reflects the interest rate differential between Czech and eurozone money markets. Covered interest parity (CIP) ensures this relationship holds in liquid markets; deviations signal either transaction costs or credit risk.
Uncovered interest parity (UIP) is theoretically elegant but empirically unreliable at short horizons. The "forward premium puzzle" means high-interest-rate currencies often appreciate rather than depreciate as UIP predicts. Use UIP as a directional signal, not a mechanical forecast.
Option-implied measures go further than forwards. Implied volatility (IV) from EUR/PLN or EUR/HUF options tells you the market's expected range of outcomes. Risk reversals (the skew between call and put IV) reveal directional bias: a negative risk reversal on EUR/HUF means the market is paying more to hedge HUF depreciation than appreciation. That asymmetry is a tail-risk signal worth monitoring. Emerging-market currency swings often show up first in option skew before moving spot rates.
Pros and cons of market-based methods:
- Pro: real-time, no model estimation required, directly linked to hedging instrument pricing
- Pro: forward rates are the natural cost-of-hedge benchmark
- Con: forward rates are not unbiased predictors of future spot; they reflect carry, not pure expectation
- Con: option markets for CE currencies can be illiquid at longer tenors, widening bid-ask spreads on IV surfaces
Pro Tip: When the implied volatility surface for PLN/EUR or HUF/EUR steepens sharply at the 1-month tenor, that is often a better early-warning signal than any macro model. Check IV before finalizing a hedge ratio.
When do technical methods add value for FX timing?
Technical analysis extracts signals from price and volume history. For corporate treasury, it is rarely the primary forecast method, but it earns its place as a short-term timing overlay.
Common indicators and their typical use cases:
- SMA/EMA crossover (20/50-day): trend identification; useful for confirming a directional view from a macro model
- MACD: momentum and trend-change detection; works on daily charts for 1–4 week horizons
- RSI (14-period): overbought/oversold signals; most useful in range-bound markets
- Bollinger Bands (20-day, 2 SD): volatility-adjusted range; breakouts signal potential trend continuation or mean reversion
- Momentum filters: rate-of-change indicators that capture carry-trade unwinding in CE currencies
Technical methods add the most value in two regimes: when a currency is trending strongly (momentum strategies work) and when liquidity is high enough that price patterns are not dominated by central bank intervention. They fail badly around policy announcements, geopolitical shocks, and thin holiday markets.
Pro Tip: Never use a technical signal as a standalone trigger for a corporate hedge. Pair it with a stop-loss rule and a position-size limit. A MACD crossover on EUR/PLN that fires two days before an NBP meeting is noise, not signal.
Machine learning approaches: where do they fit in corporate FX forecasting?
ML models have moved from academic curiosity to practical tool in treasury over the past five years. The question is not whether they work but when they are worth the overhead.
Sequence models (LSTM, RNN): Long short-term memory networks capture long-range dependencies in time-series data that ARIMA misses. Research using LSTM for FX scenario analysis shows they can function as decision companions for corporate strategy, simulating counterfactual shocks and quantifying trade-offs between profit preservation and competitiveness. The limitation is generalizability: results from a single-company case study do not transfer automatically to a different currency pair or business model.
Tree ensembles (random forest, XGBoost): These handle nonlinear feature interactions and are less prone to overfitting than deep networks when data is limited. A random forest trained on macro features (rate differentials, PMI surprises, commodity prices) plus lagged spot returns can outperform a linear VAR at 1–3 month horizons when the feature set is well-engineered.
Hybrid ML-econometric models: The most practical approach for most corporate teams. Use an econometric model (VAR or OLS) to generate a baseline forecast, then train a gradient-boosting model on the residuals. The hybrid captures nonlinear deviations from the structural baseline without abandoning interpretability entirely.
Practical improvements in forecast accuracy often come from engineering rather than model complexity. Better features, automated retraining, and combining a few robust algorithms typically outperform a single complex model.
Practical ML implementation checklist:
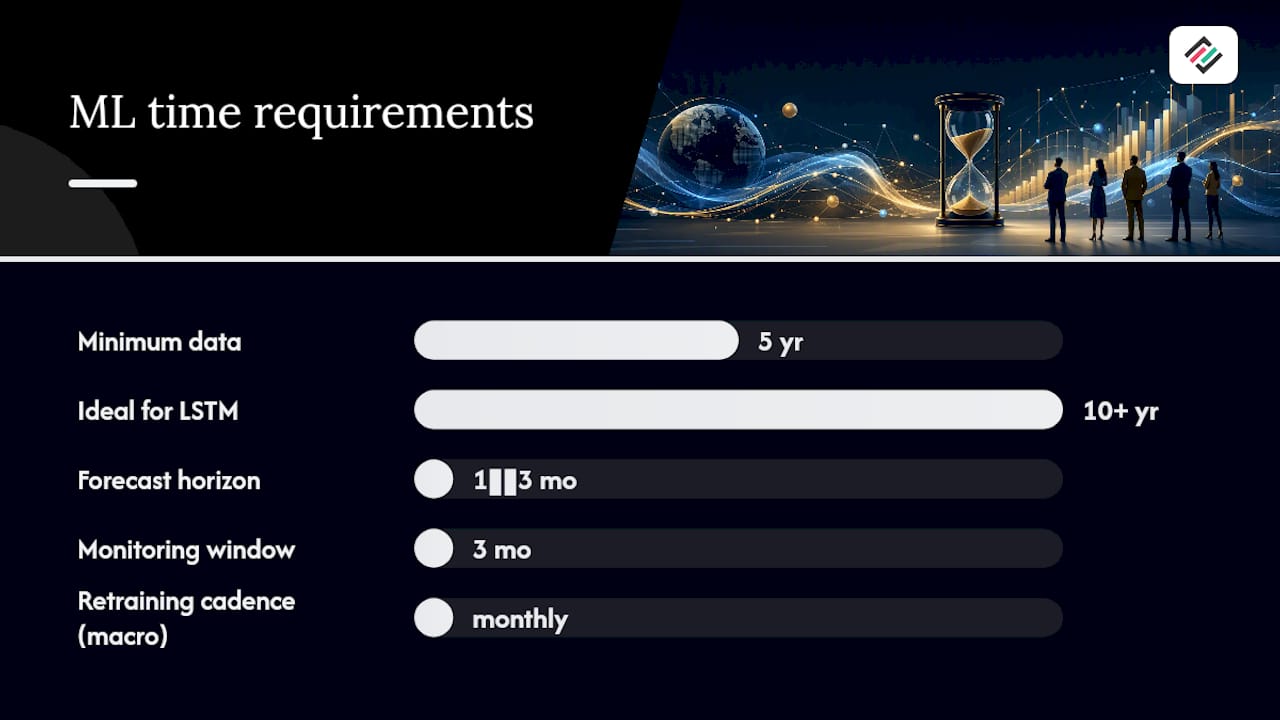
- Data volume: minimum 5 years of daily data; ideally 10+ years for LSTM
- Feature engineering: macro surprises, sentiment indices, cross-currency realized correlations
- Retraining cadence: monthly for macro-driven models; weekly for high-frequency signal models
- Monitoring: track out-of-sample MSFE and MAFE on a rolling 3-month window; alert when degradation exceeds 15% vs. baseline
- Explainability: use SHAP values or permutation importance to communicate which features drive the forecast to non-technical stakeholders
How to combine forecasts and evaluate their performance
No single model dominates across all horizons and market regimes. Combining forecasts is one of the most reliable ways to improve accuracy without adding model complexity.
Ensemble rules
- Arithmetic mean: average the point forecasts from N models. Simple, surprisingly hard to beat.
- Trimmed mean: drop the highest and lowest forecasts before averaging. Reduces the influence of outlier models.
- Inverse-MSFE weighting: weight each model by the inverse of its recent mean squared forecast error. Models that have performed better recently get more weight.
- Optimal combination (OLS): regress realized outcomes on model forecasts to estimate optimal weights. Requires a long enough evaluation window to avoid overfitting the weights themselves.
Combination works best when the constituent models are diverse (different data inputs, different functional forms) and weakly correlated in their errors. Combining three near-identical ARIMA specifications adds almost nothing.
Evaluation metrics
| Metric | Definition | Best for |
|---|---|---|
| MSFE | Mean squared forecast error; penalizes large errors heavily | Point forecast accuracy, symmetric loss |
| MAFE | Mean absolute forecast error; more robust to outliers than MSFE | Operational budgeting, symmetric loss |
| QLIKE | Quasi-likelihood loss function for volatility forecasts | Volatility model comparison |
For statistical comparison of two models, the Diebold-Mariano test and its extensions (including the Hansen model confidence set) are the standard tools. A model that beats a random walk in MSFE terms but not at conventional significance levels is a weak result; report both the metric and the test statistic.
Backtesting workflow
- Split your data: use the first 70–80% for estimation, hold out the rest for evaluation.
- Use rolling-origin evaluation: re-estimate the model at each step forward, forecast one period ahead, record the error. This mimics real operational conditions.
- Compute MSFE, MAFE, and QLIKE across the holdout window.
- Compare against a random-walk benchmark. If your model does not beat the random walk out-of-sample, it is not ready for operational use.
- Check for structural breaks in the evaluation window; a model that fails during a stress period (2020, 2022) may still be useful in calm regimes if you account for that.
What does research say about forecasting Central European currencies?
The evidence on CE currency forecasting has a clear practical message: local factors matter more than global factors alone, and volatility connectedness across the region creates hedging implications that a single-currency model will miss.
A study on CEE exchange-rate forecasting found that separating global and local components using PCA plus linear regression outperformed a random-walk benchmark at horizons from one month to over a year for PLN, HUF, CZK, and RON. Local GDP and CPI expectations were increasingly useful predictors at mid- to long-horizon returns. That result argues directly against relying only on global risk factors or a generic DXY-based model for CE currencies.
Volatility connectedness is a structural feature of CE FX markets. High-frequency analysis of CE currency volatility covering 2009–2022 shows that connectedness spikes following major global events and is linked to uncertainty, liquidity, and economic activity. During stress periods, volatility transmission across PLN, HUF, CZK, and RON is asymmetric: negative shocks propagate faster and further than positive ones. A hedging strategy that ignores this connectedness will systematically underestimate tail risk during exactly the periods when protection matters most.
Key regional considerations for method selection:
- PLN/EUR: most liquid CE pair; VAR with NBP rate and Polish CPI performs well at 1–3 month horizons; local GDP surprises are a strong predictor
- HUF/EUR: higher volatility and policy sensitivity; HAR volatility models are particularly useful; MNB credibility signals matter
- CZK/EUR: CNB's g3+ structural model is the benchmark; for corporates, a simplified VAR with Czech-eurozone rate differential and CPI gap is a practical proxy
- RON/EUR: less liquid; fundamental models with NBR policy rate and Romania's current account are the starting point
The CNB's g3+ model upgrade is the clearest example of how a central bank operationalizes structural forecasting for a small open economy. The 2025 revision's inclusion of U.S. short-term rates in the UIP condition reflects the reality that dollar-cycle effects now transmit to CE currencies through global risk appetite, not just eurozone channels.
How to choose the right forecasting method for your organization
The right method depends on four things: your forecast horizon, the data you can realistically maintain, the interpretability your decision-makers require, and the resources you can allocate to model maintenance.
Decision checklist
- Define the forecast horizon. Daily hedging decisions need market-based signals and technical overlays. Monthly budget rates need econometric models. Multi-year pricing strategy needs fundamental anchors.
- Audit your data. Do you have clean daily spot and forward data? Monthly macro series? Intraday tick data for realized variance? The answer determines which model families are even feasible.
- Assess interpretability requirements. A CFO presenting to a board needs a model she can explain in two sentences. An LSTM with 200 features does not qualify. A VAR with three macro variables does.
- Estimate maintenance cost. ARIMA needs quarterly re-estimation. A gradient-boosting ensemble needs monthly retraining and feature monitoring. ML pipelines require engineering support.
- Check regulatory and compliance needs. Some jurisdictions require documented, auditable forecast methodologies for hedge accounting under IFRS 9. A black-box ML model may not satisfy that requirement without additional explainability tooling.
- Match error tolerance to business objective. A 2% forecast error on a EUR/PLN rate matters differently for a company with 5% margins than one with 25% margins.
Prioritized starting rules
- Start here: forward rates as the market baseline plus one simple econometric model (OLS or VAR with 2–3 macro factors)
- Add next: HAR volatility model for VaR and hedging cost estimation
- Add if data and expertise exist: ML ensemble or hybrid ML-econometric for medium-horizon point forecasts
- Always: rolling backtest before operational deployment; compare against random walk
For exporters moving beyond spreadsheet-based FX tracking, multi-currency workflow basics are a practical starting point before layering in model-based forecasts.
Practical steps to operationalize your forecasting workflow
Moving from model selection to production requires a concrete implementation plan. The following checklist covers the minimum viable pipeline for a corporate treasury team.
Implementation checklist
- Data ingestion: establish automated feeds for spot rates (ECB reference rates or Bloomberg/Refinitiv), forward curves, central bank policy rates, and monthly macro releases (Eurostat, national statistical offices)
- Feature store: maintain a clean, versioned dataset with consistent frequency; document any gaps or revisions
- Model training schedule: ARIMA/VAR monthly; HAR weekly; ML models monthly with drift monitoring
- Backtesting pipeline: rolling-origin evaluation with MSFE, MAFE, and random-walk comparison; automate the report
- Performance monitoring: set alert thresholds (e.g., MSFE degradation >15% over a rolling 3-month window triggers model review)
- Governance: document model assumptions, data sources, and review cadence; assign ownership to a named team member; log all forecast-to-actual comparisons
Tool suggestions
- Lightweight econometric: Python with pandas, statsmodels, and arch (for GARCH/HAR); R with vars and rugarch packages
- ML frameworks: scikit-learn for tree ensembles; TensorFlow or PyTorch for LSTM/RNN
- Automation and alerting: Apache Airflow or Prefect for pipeline orchestration; Grafana or a custom dashboard for monitoring
- Platform option: a dedicated FX risk management platform consolidates data ingestion, model outputs, and hedging execution in one environment, which reduces the engineering overhead significantly
Cadence guidance: run market-based signal checks daily; update econometric model forecasts weekly or monthly; refresh ML models monthly; review governance documentation quarterly.
For teams managing real-time currency data pipelines, the data ingestion step is often the bottleneck, not the model itself.
What practitioners actually get wrong about currency forecasting
The most common mistake is not choosing the wrong model. It is using the right model incorrectly.
Overfitting is the silent killer. A VAR estimated on five years of data with eight variables and four lags will produce an impressive in-sample R-squared and a useless out-of-sample forecast. The fix is mechanical: always evaluate on data the model has never seen, and always compare against a random walk. If you cannot beat a random walk, you do not have a forecast, you have a narrative.
The second mistake is treating the forecast as the hedge decision. Hedge ratios should come from a VaR or efficient-frontier analysis that weighs the cost of carry against the risk reduction.
The third mistake is ignoring connectedness. During the 2022 energy shock, HUF, PLN, and CZK all moved sharply and in the same direction. A company hedging only its PLN exposure while ignoring HUF and CZK positions on the same balance sheet was not hedged, it was just hedged on paper. The volatility connectedness evidence for CE currencies makes this a structural concern, not a one-off event.
Governance matters more than model sophistication. Schedule monthly forecast reviews, reconcile model outputs against realized rates, and keep the CFO and finance director in the loop with a one-page summary. A model that runs unreviewed for six months is a liability. Corphedge's expansion into Poland and Sweden makes this governance discipline especially relevant for teams now managing PLN and SEK exposures alongside existing CE currency books.
Corphedge consolidates forecasting and hedging in one platform
Running multiple forecasting models, maintaining data pipelines, and translating outputs into hedge decisions across CZK, HUF, PLN, and RON is operationally demanding. Corphedge brings that workflow into a single environment: live market data feeds, position tracking across currency pairs, VaR-based hedging simulation, and automated alerts when exposure thresholds are breached.

The platform's VaR-based hedging workflow lets treasury teams model hedge ratios against efficient-frontier logic rather than defaulting to a blanket 100% hedge, which typically reduces carry costs while maintaining the protection level the business actually needs. For teams evaluating a build-vs-buy decision on their forecasting infrastructure, the Corphedge product tour shows how the platform handles data ingestion, scenario simulation, and reporting without requiring a dedicated data engineering team. Book a demo to see how it fits your current CE currency exposure.
Sources
- Global shocks and term structure: 2025 update of the g3+ model (CNB)
- Exchange rate forecasting methods (Investopedia)
This article is general information, not a substitute for advice from a qualified financial advisor. Consult a qualified financial professional about your own circumstances before acting on anything here.
FAQ
What are the main currency forecasting method families?
The six main families are fundamental (PPP, relative economic strength), time-series/econometric (ARIMA, VAR, VECM), volatility models (GARCH, HAR), market-based (forward rates, option-implied volatility), technical (moving averages, momentum), and machine learning (LSTM, random forest). Most practitioners combine two or three families rather than relying on one.
Which forecasting method works best for short-term currency moves?
Market-based signals, specifically forward rates and option-implied volatility, are the most reliable for short horizons (days to weeks) because they reflect live market expectations. Technical indicators like MACD and Bollinger Bands add timing value but should be paired with risk controls, not used standalone.
How do you evaluate whether a currency forecast model is any good?
Run a rolling-origin backtest on held-out data and compute MSFE (mean squared forecast error) and MAFE (mean absolute forecast error). Compare both metrics against a random-walk benchmark. A model that cannot beat the random walk out-of-sample is not operationally useful, regardless of its in-sample fit.
What forecasting approaches work best for Central European currencies like PLN, HUF, and CZK?
HAR volatility models also perform well for one-day-ahead volatility on CE pairs. Volatility connectedness across these currencies spikes during global stress events, so hedging strategies should account for cross-currency risk, not just single-pair exposure.
What are the steps to build a practical currency forecasting workflow?
Start with automated data ingestion (spot rates, forward curves, macro releases), establish a clean feature store, train and backtest your chosen models using rolling-origin evaluation, monitor out-of-sample performance with MSFE and MAFE, and set governance rules for review cadence and ownership. Begin with a market-based baseline and one econometric model before adding ML complexity.