

Currency correlation is a usable input that helps design more efficient hedge ratios and lower portfolio Value at Risk, but it is not a hedging strategy on its own. The number tells you which exposures offset each other today. It says nothing about whether that relationship holds next quarter. Use correlation to size hedges and avoid duplicating protection you already have, then rebuild the calculation often enough to catch when it stops being true.
TL;DR:
- Correlation figures only reflect current relationships and can shift significantly during market stress, making frequent revalidation essential.
- Hedge ratios derived from correlations should be updated regularly, ideally weekly for liquid pairs and monthly for less-liquid ones, to maintain effectiveness.
- Using correlation as a hedge sizing tool requires understanding its limitations, especially since relationships often depend on shared economic drivers and can vanish if conditions change.
- Portfolio-based VaR approaches integrate all exposures and their correlations, providing a more accurate risk and cost assessment than isolated currency hedging.
- Monitoring correlation breakdowns through scenario stress tests and conservative sizing helps prevent unanticipated hedge failures during crises.
Table of Contents
- What Currency Correlation Means for Hedging Decisions
- How to Calculate FX Correlation: Formula and a Worked Example
- Which FX Pairs and Commodity Currencies Move Together?
- From Correlation to Hedge Ratio: Variance, Cross-Hedging, and VaR
- Building the Correlation-Hedging Workflow: Data, Tools, and Governance
- Why Correlation-Based Hedges Fail: Breakdowns and Hidden Costs
- A VaR-First Approach to Correlation Hedging
- Why Most Hedging Programs Get Correlation Backwards
- See How Corphedge Handles VaR Hedging in Practice
- Sources
- FAQ
What Currency Correlation Means for Hedging Decisions
Currency correlation for hedging measures how two exchange rate returns move relative to each other over a given period, expressed as a coefficient between negative one and positive one. A positive correlation means the pairs tend to rise and fall together. A negative correlation means one tends to rise when the other falls. Zero means the two show no dependable pattern at all.
For a treasury team, this number answers a narrow but useful question: if you are already long one currency exposure, does a second exposure add risk, cancel it out, or do nothing either way? A finance director holding euro receivables and Swiss franc payables, for example, is often sitting on a partial natural hedge, because EUR/USD and USD/CHF have historically moved in opposite directions.
Practitioners generally work with rough interpretation bands, though these are heuristics, not laws of physics:
- Above 0.7 or below negative 0.7: strong relationship, often usable for hedge sizing.
- Between 0.3 and 0.7 (or negative 0.3 to negative 0.7): moderate, situational.
- Below 0.3 in absolute terms: weak enough that treating it as a hedge is risky.
None of this proves causation. Two currencies can move together because of a shared driver, like both being commodity currencies reacting to oil prices, or simply because of coincidental macro timing over the sample window chosen. A correlation only becomes a genuine natural hedge when there's an identifiable economic link behind it, something a rate-setting cycle, a trade relationship, or a commodity exposure explains. Absent that, the number can vanish the moment the shared driver disappears.
How to Calculate FX Correlation: Formula and a Worked Example
The standard measure is the Pearson correlation coefficient, applied to the daily (or weekly) percentage returns of two exchange rates, not their raw price levels. Using price levels instead of returns is the single most common mistake in do-it-yourself correlation analysis, because both series can trend upward together for unrelated reasons and produce a misleadingly high number.
The formula: correlation equals the covariance of the two return series, divided by the product of their standard deviations. In practice, almost nobody runs this by hand. Spreadsheet software and most FX market data providers compute it directly from a return series.
To reproduce or sanity-check a correlation figure, the calculation runs through the same four steps every time:
- Pull matched, same-timestamp price series for both currency pairs, ideally daily closes from a single provider to avoid timing mismatches.
- Convert prices to daily percentage returns for each series.
- Compute the covariance between the two return series and each series' own standard deviation.
- Divide covariance by the product of the two standard deviations to get the coefficient.
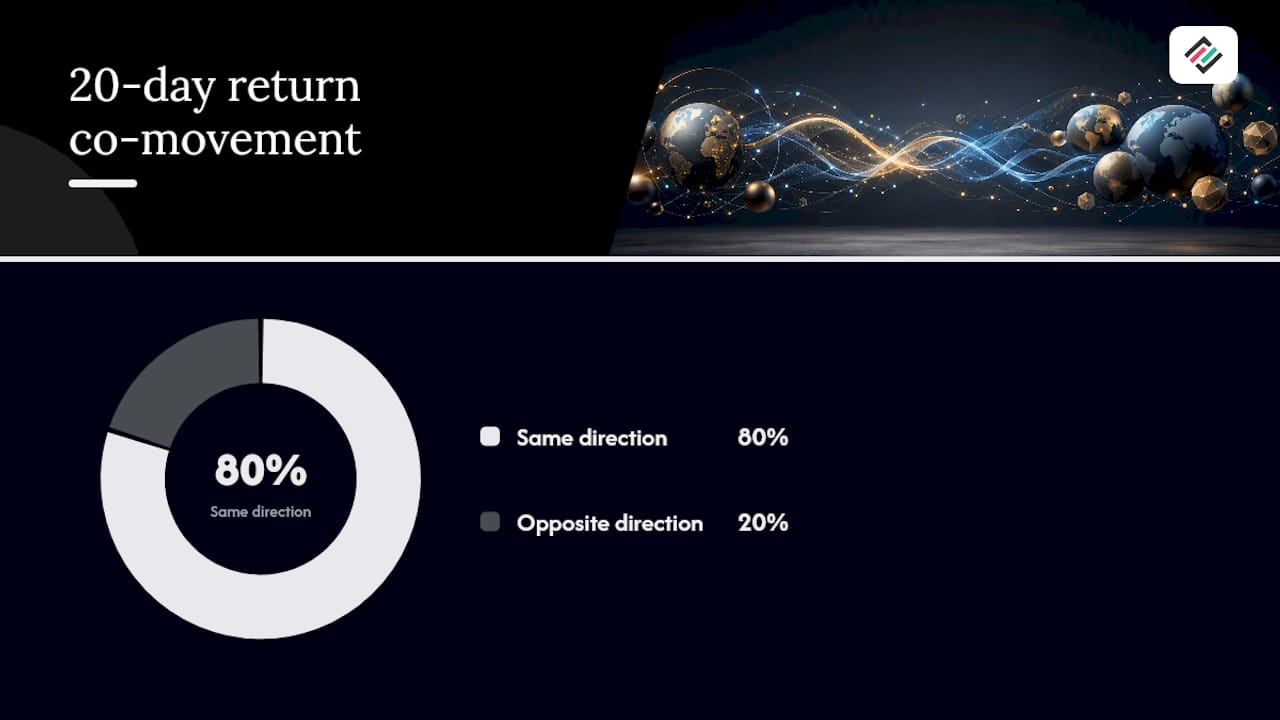
A simplified illustration: over a 20-day sample, if EUR/USD and GBP/USD returns move together on 16 of those days and in opposite directions on only 4, the resulting coefficient typically lands somewhere around 0.75 to 0.85, comfortably in the "usable for hedge sizing" range described above.
Two data issues distort this more than most people expect. Outlier days, like a surprise central bank decision, can swing a short-window correlation dramatically, so a single headline event shouldn't be allowed to define your whole hedge ratio. Non-synchronous quotes, where one pair's closing timestamp doesn't match the other's, introduce noise that makes correlations look weaker than they actually are. A 30-day rolling window reacts fast but chases noise; a 250-day window is more stable but slow to flag a genuine regime shift. Most treasury teams run both in parallel rather than picking one.
Which FX Pairs and Commodity Currencies Move Together?
Certain currency correlation relationships show up often enough in FX markets that they're worth knowing before you build a hedge model, though every one of them can weaken or invert during stress.
- EUR/USD and GBP/USD tend to move in the same direction, since both are priced against the dollar and often respond to the same dollar-strength narrative.
- EUR/USD and USD/CHF tend to move in opposite directions, because the Swiss franc has historically tracked the euro closely against the dollar.
- AUD pairs and gold prices correlate because Australia is a major gold exporter, so a rally in gold often lifts the Australian dollar alongside it.
- CAD pairs and crude oil correlate for the same reason, since Canada's export base is heavily weighted toward oil.
Whether one of these relationships is actually usable as a hedge for a specific exposure depends on three practical checks: is the correlated pair liquid enough to trade at size without moving the market, does its tenor match the exposure you're covering, and how much basis risk remains, meaning the gap between the proxy's behavior and your actual exposure's behavior. Cross-asset hedges, like using gold exposure to offset AUD risk, only make sense when that proxy risk is small relative to the cost savings, and that gap needs to be quantified, not assumed.
From Correlation to Hedge Ratio: Variance, Cross-Hedging, and VaR
A correlation coefficient tells you direction and strength. It doesn't tell you how much to hedge. That's a separate calculation, and it's where most correlation-based hedging programs actually add value or quietly fail.
The variance-minimizing hedge ratio is the most common starting point. It comes from a simple regression: regress the returns of the exposure you're hedging against the returns of the hedging instrument, and the resulting beta coefficient is your hedge ratio. The intuition is straightforward. If your exposure and your hedge instrument move together closely (high correlation, similar volatility), the ratio approaches 1.0, meaning a near full hedge. If the relationship is weaker or the volatilities differ substantially, the ratio drops, and hedging beyond that point adds cost without adding protection.
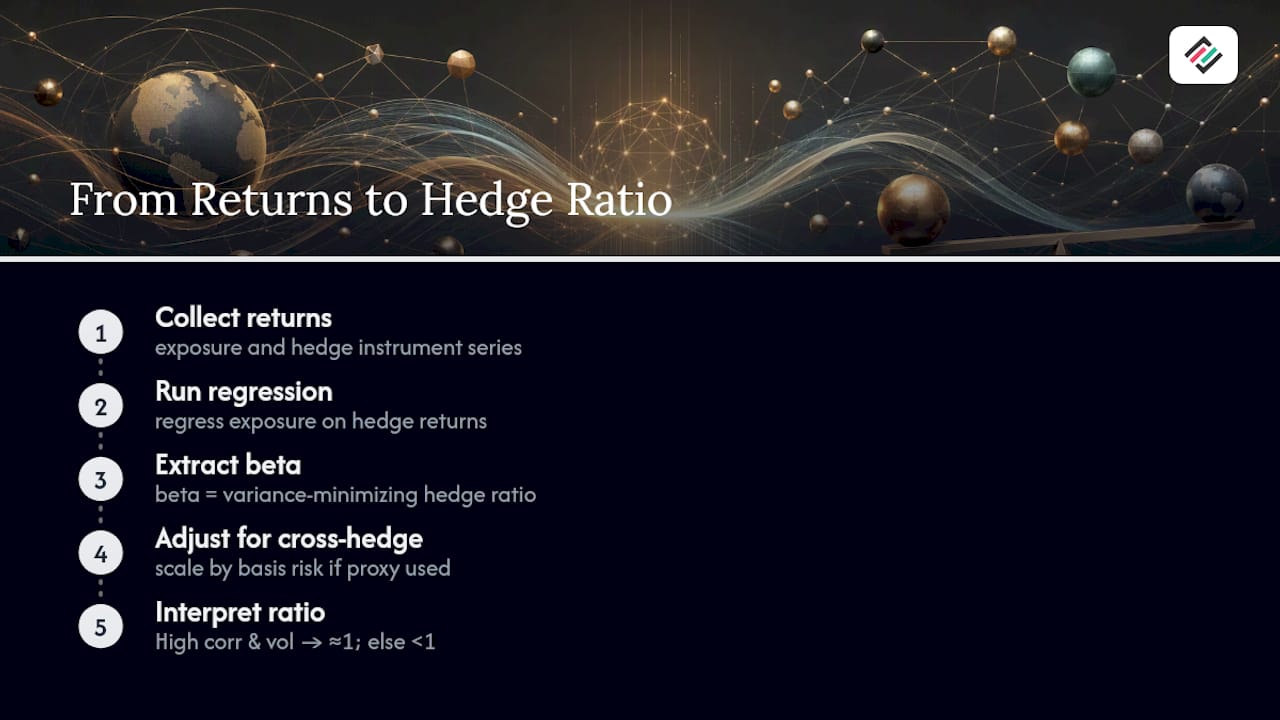
Cross-hedging applies the same logic when you don't have a direct instrument for your exact exposure and instead use a correlated proxy. A company with exposure to a thinly traded emerging-market currency might cross-hedge using a more liquid regional pair. The correction factor here matters enormously: the hedge ratio has to be scaled down from 1.0 by however much basis risk exists between the proxy and the real exposure, or the hedge will systematically over or undercorrect.
VaR-based portfolio hedging takes a broader view than either of the above. Instead of hedging currency by currency, it consolidates every exposure into one portfolio, accounts for the correlations between them, and asks a single question: what combination of hedges reduces portfolio Value at Risk the most per dollar of hedging cost? This approach can identify net exposures after cross-currency correlations are factored in, and it produces what's often called an efficiency frontier of hedge ratios, a curve plotting risk reduction against cost so a treasury team can pick the point that fits its risk appetite rather than defaulting to 100% coverage on everything.
Hedge ratios are not static. Empirical research on hedge ratio term structure finds that optimal hedge ratios decline as the horizon lengthens, falling to one-half or less at a ten-year horizon compared with short-term hedges.
That term-structure finding has a direct policy implication many corporate hedging programs miss: a company hedging a two-year revenue stream and a company hedging a ten-year debt obligation should almost never be using the same hedge ratio, even if the underlying currency pair is identical. This is part of why firms often find they're closer to optimally hedged than expected once offsetting exposures like foreign revenue are properly netted against foreign liabilities, rather than hedging each currency in isolation.
Building the Correlation-Hedging Workflow: Data, Tools, and Governance
Turning a correlation number into a live hedge program takes more infrastructure than most teams budget for upfront. Skipping any one of these four pieces is where correlation-based programs tend to quietly degrade.
- Data. You need clean, matched spot and forward series for every exposure currency, sourced from a provider with consistent timestamps across pairs. Illiquid or exotic pairs need extra scrutiny, since thin trading produces stale quotes that distort correlation estimates without any obvious warning sign.
- Tooling. At minimum, a rolling-correlation engine, a regression module for hedge ratio estimation, a VaR calculator, and a stress or scenario module that can simulate correlation breakdown. These are functional categories, and a decent internal spreadsheet model or a corporate FX risk platform can both cover them, depending on scale.
- Execution. A calculated hedge ratio has to translate into an actual tradeable instrument, whether that's a forward, an option, or a futures contract. Tenor mismatches between your exposure and the available instrument, plus carry costs on the hedge itself, both eat into the theoretical benefit and need to be priced in before you commit.
- Governance. Set a fixed revalidation cadence, define what triggers an early review, and report changes to treasury and the CFO on a schedule they can plan around.
Pro Tip: Set a hard trigger, not just a calendar. If a correlation you rely on moves by more than roughly 0.3 in absolute terms between reviews, treat that as an automatic re-validation event rather than waiting for the next scheduled check.
On cadence specifically, a workable rule of thumb many risk teams use is weekly rolling correlation checks for liquid G10 pairs, monthly for less-liquid exposures, and an immediate off-cycle review any time a major macro event hits. For teams managing this across multiple currencies and jurisdictions, that cadence becomes hard to sustain manually, which is usually the point where a dedicated tracking process replaces ad hoc spreadsheet updates.
Why Correlation-Based Hedges Fail: Breakdowns and Hidden Costs
The biggest risk in correlation-based hedging isn't a bad calculation. It's a good calculation built on a relationship that quietly stopped existing.
- Correlation convergence in crises. During market stress, correlations that were moderate or weak in calm periods can shift toward 1.0, or flip sign entirely, as everything sells off against the dollar at once. A hedge sized for a 0.4 correlation offers far less protection when the actual crisis correlation turns out to be 0.9.
- Lookback and overfitting bias. Picking whatever historical window makes your backtest look best is a common trap. A hedge ratio tuned to one specific period rarely holds up out of sample.
- Hidden costs. Carry costs, margin requirements, and the operational overhead of managing more instruments all change the true cost of a hedge, sometimes enough to shrink the ratio that actually makes economic sense.
Market correlations are highly time-varying, and stress-testing and frequent re-validation of correlation models is a standard practitioner recommendation precisely because historical averages tend to understate how badly relationships can move during a genuine crisis.
The mitigation isn't complicated, even if it's tedious: build scenario tests that explicitly assume correlation breakdown rather than trusting the historical average, size hedges a bit conservatively rather than at the theoretical optimum, and rebalance on a fixed schedule instead of waiting for a problem to force your hand.
A VaR-First Approach to Correlation Hedging
Consolidating every currency exposure into one portfolio view, rather than hedging currency by currency, is what lets a VaR calculation account for the correlations between positions and surface a genuine net risk figure. Corphedge's platform is built around that consolidated view: live position tracking, hedging strategy simulation, and automated alerts feed a portfolio VaR calculation that maps out the efficiency frontier between hedging cost and risk reduction, rather than treating each currency as an isolated decision.
[Bartas insert professional bio detailing expertise in currency risk management] That practical grounding is why the tools matter more than the math alone: real-time exposure visibility and simulation capability are what let a treasury team actually act on a correlation shift instead of finding it three weeks later in a spreadsheet.
Why Most Hedging Programs Get Correlation Backwards
Most treasury teams treat correlation as a one-time input, calculated once during policy design and left alone until someone notices a hedge isn't working the way it used to. That's backwards. The research on hedge ratio term structure and correlation instability points the same direction: correlation is a live variable that needs monitoring infrastructure, not a constant you plug in once.
The conventional advice, hedge every currency exposure at close to 100%, misses the more useful question: what's the net exposure after correlated positions are netted against each other. A company with naturally offsetting flows is often already partially hedged and doesn't know it. Overhedging that position wastes real money on protection you didn't need.
If you take one thing from this, prioritize the monitoring cadence before the modeling sophistication. A simple regression-based hedge ratio, re-validated weekly and stress-tested against correlation breakdown, will outperform a beautifully engineered model that nobody revisits after quarter one. The math is the easy part. The discipline to keep rechecking it is where programs actually succeed or quietly fail.
— Bartas
See How Corphedge Handles VaR Hedging in Practice
Corphedge is built for treasury teams that want to move past hedging each currency in isolation and start managing net exposure through a real VaR framework. The platform consolidates live currency positions, runs hedging strategy simulations, and calculates portfolio Value at Risk so you can see the cost-versus-risk tradeoff before you commit to a hedge ratio, not after.

As Corphedge expands into Poland and Sweden markets, that same VaR-first workflow, real-time position data, automated alerts, and compliance-ready reporting become available to treasury teams navigating those currencies alongside their existing exposures. If you want to see the mechanics firsthand, the hedging based on Value at Risk page walks through how the efficiency frontier calculation works in practice. For a broader look at platform capabilities, including exposure consolidation and reporting, the product tour is the fastest way to see whether it fits your current hedging setup. Start there, and book a walkthrough if the workflow matches what your team is trying to build.
This article is general information, not a substitute for advice from a qualified financial advisor. Consult a qualified financial professional about your own circumstances before acting on anything here.
Sources
- CFR_09-01-webtitle
- Value-at-Risk based approach for currency hedging (Indian Journal of Finance and Banking)
- How Avery Dennison hedged FX risk with automated VaR solution | Treasury Today
- FX debt and optimal exchange rate hedging (BIS working paper)
FAQ
Which currency pairs are correlated?
EUR/USD and GBP/USD tend to move together, while EUR/USD and USD/CHF tend to move in opposite directions; the strength of any of these relationships shifts over time, so a current correlation check matters more than a remembered rule.
What is the 5-3-1 rule in forex?
That's a trading-style guideline about focusing on a limited number of pairs, sessions, and strategies rather than a correlation or hedging framework, so it doesn't apply directly to hedge ratio design.
Does GBP/JPY correlation with USD/JPY hold consistently?
GBP/JPY and USD/JPY often show a positive correlation since both involve the yen on one side, but the strength of that relationship varies with UK and US rate differentials, so it needs regular rechecking rather than a one-time assumption.
Which currency pair correlates with gold?
AUD pairs are the most commonly cited currency correlation with gold, since Australia is a major gold exporter and the Australian dollar has historically tracked gold price moves.
How often should a hedging team re-check currency correlations?
A practical cadence is weekly for liquid G10 pairs and monthly for less-liquid exposures, with an immediate review whenever a correlation shifts sharply after a major market event.