

Currency volatility measures how much and how fast exchange rates move over a given period. A rate that swings 5% in a week is volatile; one that drifts 1% over a month is not. That distinction matters enormously for pricing, cash flow timing, contract settlement, and any trading position that crosses a currency border.
Pro Tip: Before your next cross-border contract, check the gap between your invoicing date and expected payment date. That window is your raw currency exposure, and it is the first thing worth quantifying.
Why it matters in one sentence: unmanaged currency swings can erase a profit margin that took months to build, or hand a windfall to a competitor who happened to invoice in a stronger currency.
Table of Contents
- What currency volatility actually covers
- How practitioners measure currency volatility
- What drives exchange rates to swing so hard
- How currency volatility hits companies
- How currency swings affect individuals and households
- Practical ways to manage currency risk
- What the evidence shows for Central Europe
- How to read a volatility number: is 20% high?
- Currency volatility versus currency risk: not the same thing
- Currency pairs relevant to Central Europe and their volatility profiles
- How currency volatility affects investment portfolios and cross-border assets
- Monitoring and forecasting currency volatility
- How central banks shape currency volatility
- Key Takeaways
- Currency volatility demands operational thinking, not just financial instruments
- Useful sources
- FAQ
What currency volatility actually covers
Exchange-rate volatility is not the same as the exchange-rate level. EUR/USD = 1.08 is a level. The fact that it moved from 1.08 to 1.04 and back to 1.07 inside six weeks is volatility. Confusing the two leads to bad hedging decisions.
Two rate concepts matter for planning:
- Nominal exchange rate: the quoted price of one currency in another (e.g., EUR/PLN = 4.25). Used for transaction conversion.
- Real exchange rate: the nominal rate adjusted for relative inflation between two countries. Real exchange rates better reflect competitive position and should guide long-term strategy, not just day-to-day invoicing.
Volatility itself comes in three common forms:
- Historical (realized) volatility: calculated from past price data; shows what actually happened.
- Implied volatility: extracted from currency option prices; shows what the market expects to happen.
- Intraday vs. structural volatility: short-run moves driven by sentiment and flows versus longer-run shifts tied to fundamentals like inflation or policy divergence.
Short-term sharp moves are often driven by market psychology and algorithmic flows rather than economic fundamentals alone, which is why a single news headline can move a pair by 1–2% before any macro data changes.

How practitioners measure currency volatility
The standard approach starts with daily log returns of an exchange rate, then computes their standard deviation. Annualizing that figure gives a number comparable across assets and time frames.
Formula:
Annualized volatility = Daily standard deviation × √252
(252 is the conventional number of trading days in a year.)
| Metric | Inputs | Output |
|---|---|---|
| Daily log return | Today's rate ÷ yesterday's rate, then natural log | Single-day percentage change |
| Standard deviation | Set of daily log returns over lookback window | Realized volatility for that window |
| Annualized volatility | Daily std dev × √252 | Comparable annual figure |
| Implied volatility | Currency option price + Black-Scholes model | Market's forward-looking expectation |
| Value at Risk (VaR) | Position size, volatility, confidence level | Maximum expected loss at given confidence |
Worked example: Suppose EUR/PLN posts daily log returns of 0.3%, 0.5%, 0.2%, 0.6%, and 0.4% over five days. The standard deviation of those five values is roughly 0.15%. Annualized: 0.15% × √252 ≈ 2.4%. That is a calm period. A week where the standard deviation hits 0.8% annualizes to roughly 12.7%, which sits in the moderate-to-elevated range.
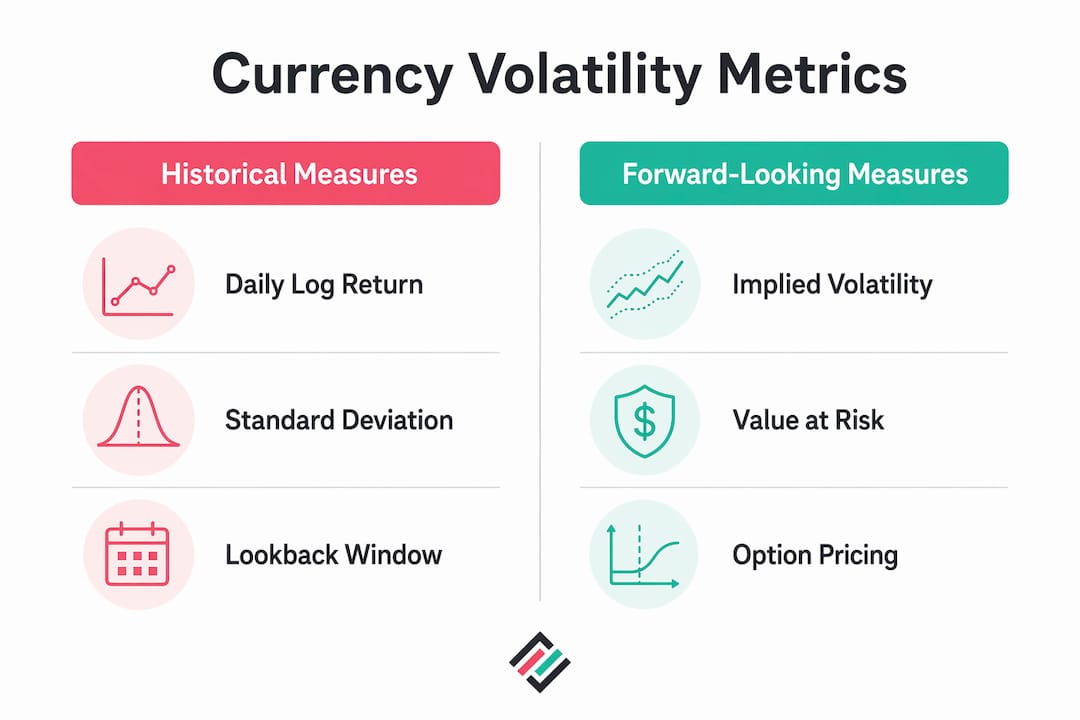
Implied volatility from currency options tells you what the market is pricing in for future moves. When implied volatility is significantly higher than recent realized volatility, the market is pricing in a shock, often around a central bank decision or election.
Value at Risk (VaR) translates volatility into a loss figure. A firm with €1 million in EUR/PLN exposure at 10% annualized volatility and a 95% confidence level can estimate its one-day VaR using the position, the daily volatility, and the 1.645 z-score. Corphedge builds VaR-based hedging directly into its platform, so finance teams can run these calculations without a spreadsheet.
Pro Tip: Lookback window matters. A 30-day window captures recent stress; a 252-day window smooths it. Use both and compare. If they diverge sharply, something structural may have changed.
What drives exchange rates to swing so hard
Macro fundamentals set the long-run direction; short-run moves are often something else entirely.
Macroeconomic drivers:
- Interest-rate differentials: higher rates attract capital, strengthening the currency.
- Inflation differentials: higher domestic inflation erodes purchasing power and weakens the real rate.
- GDP surprises and trade balance shifts: a stronger-than-expected growth print can move a pair 0.5–1% in minutes.
Political and geopolitical triggers:
- Elections, policy surprises, sanctions, and armed conflict all inject uncertainty that markets price immediately.
- A central bank that unexpectedly holds rates when the market expected a hike can produce a 2–3% intraday move.
Market microstructure:
- Thin liquidity periods (Asian session for EUR/PLN, for example) amplify moves.
- Algorithmic and momentum-driven flows can push rates well past fundamental value before mean-reversion kicks in.
A concrete example: when Russia invaded Ukraine in February 2022, the Polish zloty fell sharply against the euro within hours, not because Polish fundamentals changed overnight, but because geopolitical risk repricing hit the entire Central and Eastern European currency bloc simultaneously.
How currency volatility hits companies
The core mechanism is simple: a firm invoices in one currency and settles in another, and time passes between those two events. That gap is the exposure window, and long delivery terms and fragmented payment structures amplify it directly.
Sectors most exposed:
- Manufacturers with long lead times (automotive, machinery, chemicals).
- Commodity processors whose input prices are USD-denominated but revenues are in local currency.
- Exporters with milestone-based payment schedules stretching 90–180 days.
- Service firms billing in a client's currency while paying staff in their own.
What volatility actually costs:
- Margin compression: a 5% adverse move on a 10% margin contract wipes half the profit.
- Cash flow timing risk: the rate at invoice date versus settlement date can differ materially.
- Wage bargaining friction: exchange-rate volatility complicates wage negotiations because firms uncertain about future profits delay raises, effectively shifting the cost of volatility onto workers.
- Investment hesitation: capital expenditure decisions get deferred when revenue currency is unpredictable.
Hedging costs money, but so does not hedging. The trade-off is not "hedge or save money" but "pay a known cost now versus absorb an unknown loss later." For managing FX exposure in accounting, the key is making that trade-off explicit and documented.
Pro Tip: Add a small price buffer to long-term contracts and include a currency corridor clause. A single rate spike should not determine whether a project is profitable.
How currency swings affect individuals and households
The effects on households are less visible but just as real.
- Remittances: a 10% depreciation in the recipient's currency cuts the real value of a monthly transfer by the same proportion.
- Travel spending: a weakening local currency makes foreign hotels, meals, and transport materially more expensive.
- Imported-goods inflation: a 10% currency shock can pass through to roughly 3–4% domestic inflation, hitting grocery and energy prices.
- Foreign-currency mortgages: households in Central Europe who borrowed in Swiss francs before 2015 experienced this painfully when the CHF surged after the Swiss National Bank removed its EUR/CHF floor.
When businesses absorb currency losses, they eventually pass them on through higher prices. The household effect is often the delayed echo of a corporate hedging failure.
Practical ways to manage currency risk
Financial instruments:
- Forward contracts: lock in a rate for a future date. Eliminates uncertainty but also removes upside. Best for predictable cash flows.
- FX swaps: exchange currencies now and reverse at a future date at a pre-agreed rate. Common for short-term liquidity management.
- Currency options: pay a premium for the right, not the obligation, to exchange at a set rate. Protects against adverse moves while preserving upside. More expensive than forwards.
- Natural hedges: match the currency of revenues and costs. A Polish exporter that sources inputs in euros and invoices in euros has a built-in hedge.
Hedging strategies across FX markets vary in complexity and cost; the right choice depends on exposure size, time horizon, and how much certainty the business needs.
Operational tactics:
- Invoice in your own currency where your negotiating position allows it.
- Shorten payment terms to compress the exposure window.
- Match the currency of costs and revenues as closely as possible.
- Include price escalation clauses or currency corridors in long-term contracts.
- Use partial prepayments to reduce the open position on large orders.
When to hedge — a quick checklist:
- Exposure exceeds a threshold that would materially affect quarterly results? Hedge.
- Horizon longer than 30 days? Consider at least a partial forward.
- Accounting treatment matters (IFRS 9 hedge accounting)? Involve your auditor early.
- SME with limited derivatives access? Start with operational hedges before touching options.
Many SMEs can cut currency risk significantly through natural hedging and contract design alone, without touching a single derivative.
Pro Tip: For most SMEs, operational fixes — invoicing currency, payment terms, price buffers — deliver the majority of the risk reduction at a fraction of the cost and complexity of derivatives. Start there.

What the evidence shows for Central Europe
Academic research on Central and Eastern European economies finds that exchange-rate volatility depresses manufacturing and chemicals exports, with the negative effects showing up with a delay of one to two years. The effect is particularly robust for manufactured goods and machinery, which are core export categories for Poland and neighboring CE economies.
Key finding: Panel analysis of Central and Eastern European countries shows that higher exchange-rate volatility is associated with lower export growth in manufacturing and chemicals, with lagged effects appearing one to two years after the volatility shock.
The ECB notes that its daily reference rates are useful for reporting and benchmarking but are not the rates firms actually transact at. Finance teams in Poland and Sweden, where Corphedge is expanding, should plan cash flows around actual market transaction rates and counterparty quotes, not the ECB mid-rate.
Regional action list for firms in Poland and Sweden:
- Map all EUR/PLN and EUR/SEK exposures by settlement date, not just invoice date.
- Use natural hedging first: source inputs in the same currency as your export revenues where possible.
- Build price buffers of 3–5% into contracts with horizons beyond 60 days.
- Monitor the NBP (National Bank of Poland) and Riksbank policy calendars as volatility triggers.
- For exposures above a material threshold, consider a rolling forward program rather than one-off spot transactions.
How to read a volatility number: is 20% high?
Volatility figures quoted in markets refer to annualized standard deviation of returns, expressed as a percentage. A figure of 20% means the exchange rate is expected to move within a range of roughly ±20% over a year, with about two-thirds of outcomes falling inside that band.
Rules of thumb for currency pairs:
- Below 10%: low volatility. Typical of major pairs in calm conditions (EUR/USD in a quiet quarter).
- 10–20%: moderate. Common for emerging-market or CE currency pairs in normal times.
- Above 20%: elevated. Signals stress, political uncertainty, or a major macro divergence.
Worked example: A 20% annualized volatility translates to a monthly standard deviation of roughly 20% ÷ √12 ≈ 5.8%. That means in any given month, a one-standard-deviation move is about 5.8% of the rate. For a firm with €500,000 in open exposure, that is a potential swing of €29,000 in a single month, in either direction.
Market commentary from Morgan Stanley notes that the U.S. dollar may experience continued volatility through 2026, with potential declines and rebounds affecting cross-rate dynamics. For CE firms with USD-denominated inputs or revenues, that adds a layer of uncertainty on top of local currency moves.
Pro Tip: Always ask whether a quoted volatility figure is historical or implied. Implied volatility from options is forward-looking and often spikes before known events like central bank meetings. Historical volatility tells you what happened; implied tells you what the market is bracing for.
Currency volatility versus currency risk: not the same thing
Volatility is a market characteristic. Risk is what volatility does to your specific position.
A firm with no foreign-currency exposure faces zero currency risk regardless of how volatile EUR/PLN is. A firm with a €2 million receivable due in 90 days faces substantial currency risk even if volatility is moderate, because the position size amplifies the impact of any move.
Three types of currency risk matter in practice:
- Transaction risk: the risk that a rate moves between contract signing and settlement. The most common and most directly hedgeable.
- Economic (competitive) risk: the risk that sustained currency moves shift your competitive position relative to foreign rivals, even without direct FX cash flows.
- Translation risk: the accounting effect of converting foreign-subsidiary results into the parent's reporting currency. Affects the balance sheet but not necessarily cash.
Volatility feeds all three, but managing them requires different tools. Transaction risk responds to forwards and options. Economic risk requires strategic responses like geographic diversification or pricing strategy. Translation risk is often managed through accounting policy rather than financial instruments.
Currency pairs relevant to Central Europe and their volatility profiles
Central European businesses deal with a specific set of pairs, each with its own behavior.
EUR/PLN (euro/Polish zloty): The most liquid CE pair. Volatility tends to spike around NBP decisions, geopolitical events affecting the region, and global risk-off episodes. Poland's large manufacturing export base makes this pair critical for industrial firms.
EUR/CZK (euro/Czech koruna): Historically lower volatility than EUR/PLN, partly because the Czech National Bank has intervened actively to manage the rate. Still relevant for Czech exporters and firms with Czech supply chains.
EUR/HUF (euro/Hungarian forint): One of the more volatile CE pairs. Hungary's policy divergence from the ECB and periodic political friction with EU institutions have produced sharp moves.
EUR/SEK (euro/Swedish krona): Relevant for Corphedge's expansion into Sweden. The krona tends to weaken during global risk-off periods and strengthens when commodity and industrial sentiment improves. Riksbank policy is the primary domestic driver.
EUR/USD: The global benchmark. Moves in EUR/USD ripple through all CE pairs because many CE currencies are partially correlated with broader dollar dynamics.
How currency volatility affects investment portfolios and cross-border assets
For individuals holding foreign assets, currency moves can dominate the investment return. A Polish investor holding U.S. equities earns the dollar return plus or minus the EUR/USD and USD/PLN moves. In a year when U.S. stocks rise 10% but the zloty strengthens 8% against the dollar, the net local-currency gain is closer to 2%.
For businesses, cross-border asset valuation creates translation exposure. A German subsidiary's balance sheet, when consolidated into a Polish parent's accounts, will show different values depending on the EUR/PLN rate at the reporting date. This is not a cash loss, but it affects reported equity and leverage ratios, which matter for covenants and credit ratings.
Portfolio-level currency risk can be managed through currency-hedged fund share classes, FX overlay strategies, or simply by diversifying across currency zones so that gains in one offset losses in another. For most individual investors, the practical first step is understanding what currency their assets are actually denominated in, which is often not the currency of the exchange where the asset trades.
Monitoring and forecasting currency volatility
No model predicts exchange rates reliably over short horizons. What you can do is monitor the conditions that tend to precede elevated volatility.
Economic indicators to watch:
- Central bank meeting calendars (ECB, NBP, Riksbank, Fed).
- Inflation prints relative to expectations.
- Trade balance and current account data.
- PMI surveys for manufacturing and services.
Market sentiment signals:
- Implied volatility from currency options (the VIX equivalent for FX is the CVIX index).
- Positioning data from the CFTC Commitments of Traders report for major pairs.
- Credit default swap spreads for sovereign risk in CE economies.
Practical monitoring approach: Set rate alerts at levels that would materially affect your open positions. Review implied volatility before known event dates. Use the Corphedge platform for real-time position monitoring and VaR calculations that update as rates move.
For effective currency risk management in current conditions, the combination of economic calendar awareness and real-time position tracking is more useful than any single forecast model.
How central banks shape currency volatility
Central banks are the single most powerful actors in currency markets, and their influence operates through multiple channels.
Interest rate decisions are the primary tool. A rate hike attracts foreign capital seeking higher yields, strengthening the currency. The surprise element matters as much as the direction: a hike that was fully priced in moves the market less than one that catches traders off guard.
Direct intervention occurs when a central bank buys or sells its own currency to influence the rate. The Swiss National Bank's 2015 decision to abandon the EUR/CHF floor is the textbook CE-adjacent example: removing the cap caused the franc to surge roughly 20% against the euro in minutes. The Czech National Bank used the opposite approach, buying euros to keep the koruna weak between 2013 and 2017.
Forward guidance shapes volatility even without action. When the ECB signals a prolonged pause, it reduces uncertainty and compresses implied volatility in EUR-crosses. When guidance is ambiguous or contradicted by data, volatility rises.
Currency corridors and managed floats are common in CE economies. Hungary, Romania, and others have at various points managed their exchange rates within informal bands. Firms operating in these markets should track central bank communication as carefully as they track economic data.
Key Takeaways
Currency volatility is the frequency and magnitude of exchange-rate moves, and unmanaged exposure to it can erase margins, disrupt cash flows, and delay investment decisions for businesses of any size.
| Point | Details |
|---|---|
| Volatility vs. risk | Volatility is a market feature; currency risk is what it does to your specific open position. |
| Measure it first | Use annualized standard deviation and VaR to quantify exposure before choosing a hedge. |
| Operational hedges first | Natural hedging, invoicing currency, and price buffers reduce risk at low cost for most SMEs. |
| CE sectors most exposed | Manufacturing and chemicals exports in Central Europe show delayed negative effects from volatility spikes. |
| Monitor central banks | NBP, Riksbank, and ECB decisions are the primary near-term volatility triggers for CE currency pairs. |
Currency volatility demands operational thinking, not just financial instruments
Most finance commentary on currency volatility defaults immediately to derivatives: forwards, options, swaps. That framing is not wrong, but it is incomplete in a way that costs smaller firms real money.
The firms that handle currency volatility best are not necessarily the ones with the most sophisticated hedging programs. They are the ones that have reduced their raw exposure through operational design: they invoice in their own currency where possible, they shorten payment terms, they source inputs in the same currency as their revenues, and they build price buffers into contracts before they ever call a bank about a forward.
Derivatives are a second line of defense, not the first. A forward contract on a poorly structured contract with a 180-day payment window is a more expensive solution to a problem that a 60-day payment term would have partially solved for free. The research on Central and Eastern European SMEs consistently points in this direction: operational measures reduce exposure cost-effectively before any derivative is needed.
That said, once exposures are large enough that a single rate move could materially affect quarterly results, financial instruments earn their cost. The mistake is reaching for them before the operational groundwork is done.
Useful sources
The following sources informed this article and are worth consulting for deeper study:
- ECB exchange rate explainer: This explains the difference between reference rates and transaction rates, and how exchange rates affect competitiveness and trade. It is essential for corporate planning context.
- OENB academic paper on CE export performance: Panel and time-series analysis of how exchange-rate volatility affects manufacturing and chemicals exports across Central and Eastern Europe. The primary empirical source for the regional evidence section.
- Ekonomika.lt practitioner guidance: Practical steps for small exporters managing currency risk, including natural hedging, payment-term design, and price buffers. Directly applicable for SMEs in Poland and the Baltic region.
- Qucosa repository — wage bargaining research: Academic research on how exchange-rate volatility affects labor markets and wage decisions in floating-rate CE economies.
- Corphedge blog — currency risk management: Step-by-step framework for mapping exposure and selecting hedges, written for finance teams at global firms.
FAQ
What does currency volatility mean?
Currency volatility measures how much an exchange rate fluctuates over a given period, expressed as the annualized standard deviation of daily returns. High volatility means large, frequent rate swings; low volatility means the rate moves slowly and predictably.
Is 20% volatility high for a currency pair?
Twenty percent annualized volatility is elevated for major pairs like EUR/USD but common for emerging-market or Central European pairs during periods of stress. It implies a monthly one-standard-deviation move of roughly 5.8%, which translates to a material dollar or euro swing on any significant open position.
What causes currency volatility?
The main drivers are interest-rate and inflation differentials between countries, GDP and trade data surprises, political events and policy shocks, and market microstructure factors like thin liquidity and algorithmic trading flows.
Is the U.S. dollar volatile?
The dollar is the world's reserve currency and generally less volatile than emerging-market currencies, but it is not immune to sharp moves. Market analysis points to continued USD volatility through 2026, with potential declines and rebounds that affect cross-rate dynamics for Central European firms with dollar-denominated exposures.
How is currency volatility different from currency risk?
Volatility is a property of the market; currency risk is the financial impact of that volatility on a specific position. A firm with no foreign-currency exposure has no currency risk regardless of market volatility, while a firm with large open positions faces significant risk even in moderate-volatility conditions.