

The most effective way to improve cash forecasting accuracy is combining five actions at once: connect your bank and ERP data directly, run layered rolling forecasts (13 week plus 12 month), enforce a strict variance analysis cadence, standardize your finance taxonomy, and pilot predictive models only after the basics work. Treasurers who frequently use AI/ML already see the payoff: 45% report high accuracy on 13 week forecasts versus 35% of treasurers overall.
Prioritize these six moves first:
- Centralize bank feeds and kill manual CSV uploads
- Run a rolling 13 week direct cash forecast alongside your 12 month view
- Build a weekly variance analysis habit, not a monthly afterthought
- Agree on one finance taxonomy across every entity
- Pilot a targeted predictive model on one receivables segment
- Assign clear ownership for each forecast layer
Get these right and three things happen fast: borrowing costs drop because you stop holding unnecessary buffer cash, surprise shortfalls become rare instead of routine, and decisions on financing or hedging move days faster because you trust the numbers in front of you.
Key Takeaways
Accurate cash forecasting comes from combining connected data, layered rolling forecasts, disciplined variance analysis, and selectively deployed predictive models under strong governance.
| Point | Details |
|---|---|
| Fix data connectivity first | Automate bank and ERP feeds before investing in predictive models or advanced analytics. |
| Run layered forecasts | Pair a 13 week rolling forecast with a 12 month view, and add a 3-way forecast once both are stable. |
| Classify variances, don't just report them | Separate timing, amount, and omission errors to find the real root cause. |
| Pilot before you scale | Use a 3 to 4 week diagnostic sprint to test predictive models on one segment before wider rollout. |
| Govern AI carefully | Frequent AI users report higher accuracy, but only with clean data, explainability, and independent assurance. |
This article is general information, not a substitute for advice from a qualified financial advisor. Consult a qualified financial professional about your own circumstances before acting on anything here.
Table of Contents
- Actionable Steps to Improve Cash Forecasting Accuracy
- How Do You Run Effective Variance Analysis?
- What Forecast Horizons and Cadence Should You Use?
- How Do You Introduce Scenario Planning and AI Safely?
- How Do You Build Governance That People Trust?
- Which KPIs Actually Measure Forecast Performance?
- How Do You Pilot Predictive Forecasting Without Big Risk?
- What Good Cash Forecasting Actually Looks Like
- Sources
- FAQ
Actionable Steps to Improve Cash Forecasting Accuracy
Each of these methods works on its own, but stacking them compounds the effect. Start with whichever gap costs your team the most sleep.
- Centralize bank feeds. Week one: connect your top three banks by transaction volume through direct feeds or APIs instead of manual downloads.
- Run a 13 week rolling direct forecast. Week one: pull the last 13 weeks of actuals to calibrate your starting assumptions.
- Implement a variance analysis cadence. Week one: pick a fixed day (Friday, say) and lock it into the calendar as non negotiable.
- Harmonize your taxonomy. Week one: list every term your regional teams use for "available cash" and pick one.
- Pilot machine learning on receivables timing. Week one: identify one customer segment with clean, consistent payment history to test against.
- Add KPIs and a dashboard. Week one: define forecast error percentage as your first metric and start tracking it, even manually.
- Introduce scenario planning. Week one: draft three scenarios (base, stressed, upside) for your next quarter.
- Standardize submission templates. Week one: replace free-form spreadsheets with one locked template across entities.
Pro Tip: If your team has bandwidth for only two of these this quarter, pick bank feed centralization and variance analysis. Everything else depends on having clean, timely data and a habit of checking your work against it.
How Do You Run Effective Variance Analysis?
Variance analysis only improves accuracy when you classify the error before you fix it. Three categories cover most cases: timing variances (the cash arrived, just not when predicted), amount variances (the number itself was wrong), and omissions (something never made it into the model at all). Lump these together and you'll chase the wrong root cause every time.
Run a simple three step loop:
- Compare actuals against forecast for the period, broken out by entity and category
- Classify each variance by root cause, not just by size
- Fix the underlying process, whether that's a bad assumption, a missing data feed, or a submission that came in late
Run this weekly for 13 week forecasts and monthly for 12 month views. FTI Treasury's analysis of forecast failures points to fragmented data and misaligned incentives as recurring structural causes, not one-off mistakes.
Pro Tip: Assign one named owner per entity for variance tracking and publish the numbers where everyone can see them. A blame-free escalation path matters here. The moment variance reporting turns into finger-pointing, people start smoothing numbers instead of reporting them honestly.

What Forecast Horizons and Cadence Should You Use?
The 13 week rolling forecast is the workhorse of short-term liquidity management, and J.P. Morgan recommends pairing it with daily cash positioning as core treasury practice. Set it up in week one by mapping every recurring inflow and outflow at the transaction level, not the account level.
A 3-way forecast links cash, profit and loss, and balance sheet projections. It's worth adopting once your 13 week and 12 month forecasts are stable, because it catches distortions that a cash-only view misses, like working capital swings that look fine on paper but drain liquidity in practice.
Match cadence to the decision it informs:
- Daily: short-term funding and investment decisions, FX settlement timing
- Weekly: the 13 week rolling view, variance checks, working capital management
- Monthly: 12 month strategic view, board reporting, covenant testing
How Do You Introduce Scenario Planning and AI Safely?
Build scenarios around a simple template: state your assumptions, define the trigger event, estimate the likely cash impact, and list mitigation steps. A currency shock scenario for a company expanding into Poland or Sweden, for instance, should specify the exchange rate move that triggers action and what hedging response follows.
Before deploying any predictive model, work through this checklist:
- Confirm the underlying data is clean and complete, not just abundant
- Require explainability, not a black box that spits out a number nobody can defend
- Set up ongoing monitoring to catch model drift
- Bring in independent assurance for anything feeding board-level decisions
PwC's 2025 Global Treasury Survey found 74% of treasury respondents are expanding or actively using AI, with strong focus on machine learning and predictive analytics. That adoption comes with real governance risk. EY's guidance on AI assurance flags data privacy exposure and hallucination as specific risks in models used for forecasting, which is exactly why the frequent AI users who report higher accuracy also tend to be the ones with tighter data controls, not just better algorithms.
How Do You Build Governance That People Trust?
Every forecast layer needs a named owner, not a committee. A simple role matrix works: an owner accountable for accuracy, contributors who submit entity-level data, a reviewer who checks it before it rolls up, and an approver who signs off before it reaches leadership.
Standardize these five terms across every entity before you do anything else:
- Cash on hand
- Available balance
- Committed payments
- Expected receipts
- Forecast variance
Pro Tip: Sequence your rollout around quick wins. Fix taxonomy and bank feeds first, since those deliver visible improvement within weeks. Save the harder cultural changes, like getting regional finance leads to submit on a fixed schedule, for after people have already seen the payoff.
Which KPIs Actually Measure Forecast Performance?
Track forecast error percentage by horizon (comparing 13 week versus 12 month accuracy separately, since they behave differently). Add mean absolute error to catch systematic bias, and a hit rate showing what percentage of forecasts land within your tolerance band, say plus or minus 5%.
Useful dashboard widgets include a rolling 13 week band chart, an entity-level heatmap showing which business units consistently miss, and a variance trend broken out by root cause. Review these monthly at minimum, and feed what you learn straight back into your variance analysis process rather than filing it away.
How Do You Pilot Predictive Forecasting Without Big Risk?
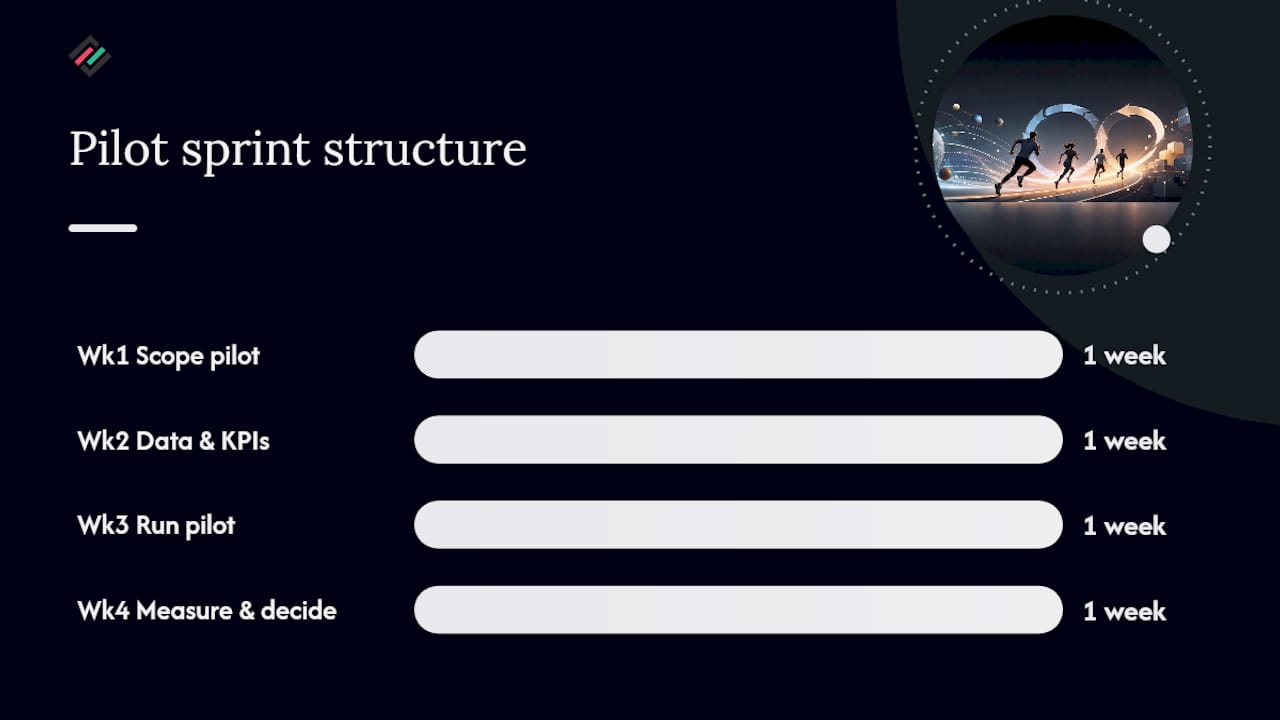
KPMG recommends a rapid three to four week diagnostic before scaling any predictive capability, and that sprint structure works well for most mid-size treasury teams.
- Week 1: Scope the pilot and map your current data sources and gaps
- Week 2: Fix quick data hygiene issues and stand up baseline KPIs
- Week 3: Run the pilot model or layered forecast against one segment
- Week 4: Measure results against your success criteria and decide whether to scale
Your pilot checklist should nail down scope, exact data requirements, the metric that defines success, a named owner, and rollback criteria if the model underperforms. Corphedge's executive FX checklist offers a similar four week structure worth adapting for currency-exposed forecasting specifically.
Pro Tip: Set your rollback criteria before you start, not after you see disappointing results. It's much easier to agree on "we'll shelve this if accuracy doesn't improve by X" when nobody has a stake in the outcome yet.
What Good Cash Forecasting Actually Looks Like
Most forecasting failures I've seen trace back to teams automating a broken process instead of fixing it first. A model built on inconsistent inputs just produces confident wrong answers faster than a spreadsheet would.
Two lessons hold up consistently. First, fix the process before you automate it. Bad assumptions and unclear ownership don't disappear because you bought software. Second, measure accuracy by entity, not just at the consolidated level. A company with strong average forecasts can still have one subsidiary bleeding cash unpredictably, and blended numbers hide that until it's too late.
If you're building out this function, the first three hires or skills worth adding are a data engineer to handle integration work, a forecasting analyst who understands variance analysis rather than just spreadsheet mechanics, and a change lead who can get regional teams to actually adopt new templates and cadences.
For companies managing multi-currency exposure, especially those extending operations into new markets, forecasting accuracy and hedging strategy are tightly linked. A platform like Corphedge's product tour shows how live currency position tracking and Value at Risk analysis feed directly into more reliable cash projections, since currency swings are often the single biggest source of forecast error for internationally active companies. Corphedge's feature set includes exposure reporting and automated notifications built specifically to close that gap between your forecast and what actually lands in the bank.
Sources
Not all data sources deserve equal attention up front. Rank them by how directly they drive near-term accuracy:
- EY Global DNA of the Treasurer Survey (2025)
- Why cash forecasts fail: five structural problems (and how to fix them) - FTI Treasury
- 2025 Global Treasury Survey: PwC
- How to Create Cash Flow Forecasts & Projections | J.P. Morgan
A practical rollout looks like three phases. Immediate: automate bank feeds through APIs and eliminate manual CSV handling. Medium term: integrate your ERP and treasury management system so cash data updates without a human touch, a step covered in more detail in Corphedge's review of treasury and liquidity reporting software. Long term: build toward a shared data layer that can feed predictive models later.
Watch for three pitfalls along the way:
Gartner's research on cash flow forecasting identifies disconnected systems as a primary barrier to forecast reliability, ahead of most modeling problems teams worry about instead.
FAQ
What Are the Different Methods for Cash Forecasting?
The main methods are direct forecasting (tracking actual cash inflows and outflows, best for short horizons like 13 weeks), indirect forecasting (starting from projected earnings and adjusting for non-cash items, better suited to longer horizons), and 3-way forecasting, which links cash, profit and loss, and balance sheet projections together.
What Are Some Strategies to Improve Cash Flow?
Improving cash flow itself, rather than just the forecast, usually means tightening receivables collection, negotiating better payment terms with suppliers, and reducing unnecessary buffer cash once your forecasting accuracy makes that buffer less necessary.
What Is a 3-Way Cashflow Forecast?
A 3-way forecast integrates the cash flow statement, profit and loss statement, and balance sheet into one connected model, so you can see how earnings and balance sheet changes actually translate into cash movement rather than viewing cash in isolation.
How Do You Build a Cash Forecast?
Start with the British Business Bank's four-step approach: decide your forecast period, list expected income, list expected outgoings, and calculate net cash position. From there, layer in a 13 week rolling structure and variance analysis to keep improving accuracy over time.