

Historical VaR for FX is an empirical, percentile-based estimate of loss built by replaying real past currency moves against your current book. It earns its keep because it captures fat tails and non-linear payoffs (options, barriers) when you run full revaluation instead of a delta approximation. The catch: it only knows what already happened, so a lookback window without a comparable shock will understate risk until that shock hits.
TL;DR:
- Historical VaR captures tail risks and non-linear payoffs by replaying actual past FX moves, but it may underestimate risk if recent shocks are absent from the sample.
- Using a lookback window of about 250 days balances responsiveness to volatility shifts while avoiding stale data, with exponential weighting for faster adaptation.
- Full revaluation is essential for convex instruments like FX options, as delta approximations can significantly misstate tail risk, especially during regime changes.
- Combining VaR with Expected Shortfall and specific crisis scenarios provides a clearer picture of tail risks than relying on a single number alone.
- Automated platforms that integrate live data, full revaluation, and backtesting improve reliability, especially when managing portfolios with multiple currencies and complex instruments.
Table of Contents
- What Is Historical VaR for FX and How Does It Work?
- How Do You Calculate Historical VaR for an FX Book?
- Historical VaR vs. Parametric and Monte Carlo VaR: Which Fits Your FX Book?
- EWMA and Filtered Historical Simulation: Making FX VaR More Responsive
- How Do You Backtest and Validate Historical VaR for FX?
- Making Historical VaR Operational: Platform Notes
- A Practitioner's Warning on Historical VaR
- How Corphedge Turns Historical VaR Into a Daily Habit, Not a Quarterly Report
- Sources
- FAQ
What Is Historical VaR for FX and How Does It Work?
Historical simulation VaR takes a stretch of actual daily FX returns, applies each one to your current positions, and builds a simulated profit-and-loss vector. No assumptions about normal distributions, no covariance matrix to estimate. You just ask: "If tomorrow behaves like any of the last N days, what happens to this book?"
Once you have that P&L vector sorted from worst to best, VaR is a percentile read-off. A 95% VaR is the loss at the 5th worst percentile; 99% VaR moves further into the tail, to the 1st percentile. With a 250-day window, 95% VaR sits close to the 12th or 13th worst observation, and interpolation smooths the read-off when the exact rank falls between two data points.
This matters more for currencies than most asset classes because exchange rate returns routinely show excess kurtosis.pdf?sfvrsn=1a1ea01d_6), meaning tail moves happen more often than a bell curve would predict. Historical VaR picks that up automatically, provided the tail event lives inside your sample.
Two common variants:
- Equal-weighted historical simulation: every day in the window counts the same, whether it's from six months ago or six days ago.
- Exponentially weighted historical simulation: recent days get more influence, so the model reacts faster to a volatility regime change.
The three primary approaches to VaR are historical simulation, parametric (variance-covariance), and Monte Carlo, and historical simulation tends to win on simplicity and its ability to reflect non-linear risk without forcing a distributional assumption onto currency returns that rarely behave normally.
How Do You Calculate Historical VaR for an FX Book?
Calculating historical VaR for FX follows a repeatable sequence, but each step has a decision buried in it that changes your output meaningfully.
- Pick the lookback window. A 250-day window (roughly one trading year) reacts faster to new volatility regimes; 500 or 1,000 days smooths out noise but drags in stale conditions. Investopedia's walkthrough uses 250 to 500 days as the common range, and that's a reasonable starting band for most FX desks.
- Choose your return type. Log returns are additive across time and easier to aggregate; simple arithmetic returns are more intuitive for P&L reporting. Either works, but pick one and stay consistent, and scrub the series for stale quotes, holiday gaps, and midnight rollover artifacts that distort a currency pair's daily return.
- Decide on revaluation method. Linear instruments like spot and forward positions tolerate a sensitivity-based shortcut. FX options and other convex instruments do not. Full revaluation against every historical scenario is the only way to capture how an option's payoff bends, since delta and gamma approximations can materially misstate tail risk on instruments with real convexity.
- Apply the historical returns to today's positions. Generate one P&L outcome per historical day. This means yesterday's shock to USD/JPY gets applied to today's actual position size, not the position you held back then.
- Sort the P&L vector and select your percentile. Interpolate between the two nearest points if the percentile rank isn't a whole number.
- Scale and report. If you need a 10-day VaR from a 1-day calculation, resist the square-root-of-time shortcut for FX options books. It assumes independent, identically distributed returns, which convex instruments violate. Report Expected Shortfall and a handful of worst-case scenarios alongside the headline VaR number.
Pro Tip: Never report a single VaR number in isolation. Pair it with Expected Shortfall and at least two or three named historical scenarios (a specific crisis date, a specific central bank surprise) so stakeholders see what's actually driving the tail, not just how big it is.
Historical VaR vs. Parametric and Monte Carlo VaR: Which Fits Your FX Book?
Each method trades something for something else, and the right choice depends on what your book actually holds.
Parametric VaR (variance-covariance) is fast and scales well across thousands of positions because it only needs volatilities and correlations, not a full price revaluation. Its weakness is baked into the assumption: it treats returns as normally distributed, which flattens the fat tails that currency pairs regularly produce, and it can't represent option convexity without extensions like delta-gamma corrections that themselves lose accuracy in extreme moves.
Monte Carlo VaR generates thousands of simulated paths from a specified stochastic process, which makes it the most flexible choice for path-dependent instruments and custom stress scenarios. That flexibility costs computation time and requires you to specify a model for how FX rates evolve, introducing model risk that historical simulation sidesteps by using observed data directly.
Historical VaR has its own failure modes worth naming plainly:
- The ghosting effect: a large historical loss stays fully weighted in your VaR estimate right up until the day it rolls out of the window, then VaR drops sharply even though nothing about current risk actually changed.
- Blindness to unprecedented shocks: if your lookback window has never seen a particular kind of move, historical VaR won't anticipate it.
- Sample-size sensitivity: shorter windows swing more with each new data point; longer windows react too slowly to genuine regime shifts.
A workable rule of thumb: lean on historical VaR for books carrying FX options or other convex exposure where full revaluation and fat-tail capture matter most. Use parametric VaR for fast, firm-wide aggregation across many desks. Bring in Monte Carlo when you need bespoke stress scenarios or path dependency that neither of the other two methods handles well.
EWMA and Filtered Historical Simulation: Making FX VaR More Responsive
Plain historical simulation has one structural weakness for currency markets: it treats a quiet Tuesday from ten months ago exactly the same as yesterday's volatility spike. Two refinements fix that.
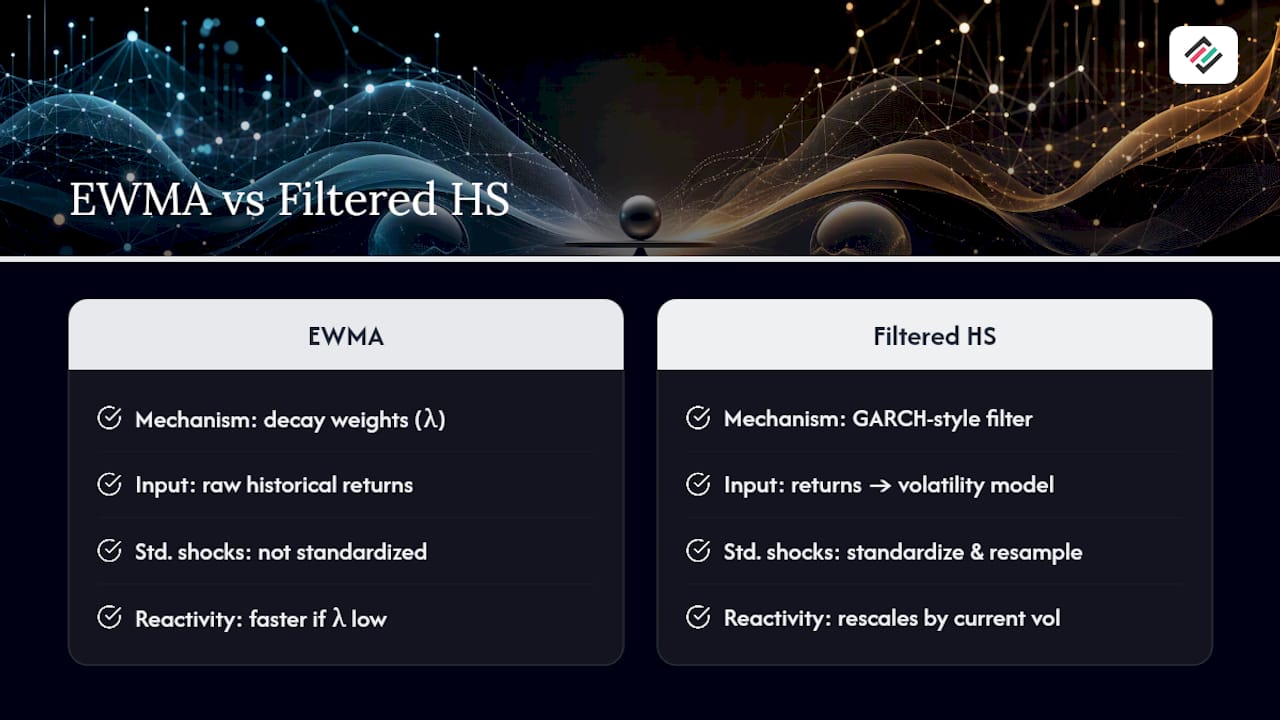
Exponentially weighted historical simulation applies a decay factor, often written as lambda (λ), that shrinks the influence of older observations geometrically. A higher lambda (closer to 1) means slower decay and more stability; a lower lambda reacts faster but gets noisier. This is the BRW-style refinement (named for Boudoukh, Richardson, and Whitelaw) that risk teams have used for decades to keep historical VaR from lagging a genuine shift in currency volatility.
Filtered Historical Simulation (FHS) goes a step further. Instead of reweighting raw returns, it first filters them through a GARCH-style volatility model, standardizes the residuals, then resamples those standardized shocks and rescales them by current volatility. The Bank of England's working paper on filtered historical simulation found FHS and exponentially weighted approaches improve responsiveness to changing conditions, but flagged a real cost: these methods can turn procyclical, tightening risk estimates during calm periods and expanding them sharply once volatility jumps, right when capital is hardest to raise.
That tradeoff needs constant supervision, because time-varying correlations and limited sample length remain genuine open problems for filtered historical simulation, according to research published in the Journal of Banking & Finance. Comparative work on FX portfolios has also found GARCH-based models outperforming naive historical simulation in many settings, though results depend heavily on how concentrated the currency positions are and what horizon you're measuring.
There's no universal best lambda or filter specification. A desk with a concentrated EUR/USD or GBP/USD book that trades through frequent central bank decisions probably wants faster decay than a broadly diversified multi-currency portfolio, where smoothing out noise matters more than chasing every headline.
How Do You Backtest and Validate Historical VaR for FX?
A VaR model that isn't backtested is a guess wearing a spreadsheet. Validation for FX books runs on a few concrete checks.
- Count your exceptions. A 99% VaR should be breached on roughly 1% of trading days, a 95% VaR on roughly 5%. Over a 250-day year, that's about two or three breaches at the 99% level. Far more or far fewer than expected is a signal something's off, whether that's the window length, the weighting scheme, or a structural shift in the currency pairs you're holding.
- Run a Kupiec-style binomial test. This formalizes the exception count into a statistical test of whether the observed breach rate is consistent with the model's stated confidence level, rather than relying on a gut sense of "that seems like a lot."
- Watch for clustering. Three breaches spread evenly across a year is different from three breaches in the same week. Clustered violations point to correlation breakdown or a volatility regime the model hasn't adapted to yet, even if the raw exception count still looks acceptable.
- Remediate deliberately. Adjust the lookback window, revisit your decay factor, add scenario-based stress tests to catch what historical data alone won't, or increase the capital buffer while you investigate.
- Document everything. Model governance and audit trails require a written record of test results, remediation steps, and the reasoning behind any parameter change, not just the final VaR number that lands on a risk report.
Making Historical VaR Operational: Platform Notes
Running historical VaR by hand across a multi-currency book quickly turns into a spreadsheet with more failure points than insight. The calculation needs live position data, a clean historical return series per currency pair, a revaluation engine that handles FX options correctly, and a backtesting process that runs on a set schedule rather than whenever someone remembers.
A risk management platform can bring real-time currency position tracking together with VaR analytics built to reflect exactly this workflow: full revaluation rather than a delta shortcut, exception tracking against expected violation rates, and reporting that rolls positions across multiple currency pairs into a single figure.
The gap between knowing the historical VaR methodology and running it reliably every trading day is where most FX risk teams actually struggle. Automation of data cleaning, revaluation, and backtesting closes that gap far more effectively than adding another manual spreadsheet check.
Bartas has covered FX volatility modeling and VaR-based hedging extensively, with a consistent focus on where theoretical models break down against actual multi-currency trading books.
A Practitioner's Warning on Historical VaR
I've watched a lookback window quietly drop a currency crash the week before a new volatility spike hit, and VaR looked calm right when it should have been screaming. Three guardrails held up: pair VaR with Expected Shortfall, keep a live scenario library, and backtest monthly, not quarterly.
— Bartas
How Corphedge Turns Historical VaR Into a Daily Habit, Not a Quarterly Report
Building historical VaR in a spreadsheet means someone owns the lookback window, the revaluation logic, and the backtest, usually on top of five other jobs. Corphedge replaces that patchwork with a live revaluation engine, real-time FX position feeds, and VaR analytics that run the percentile calculation and exception tracking automatically every trading day.

As Corphedge expands into Poland and Sweden markets, that automation matters even more for treasury teams managing exposure across a wider set of currency pairs without adding headcount. If your book includes FX options or other convex instruments, the platform's VaR-based hedging tools handle full revaluation instead of a sensitivity shortcut, so your tail risk numbers actually reflect what you hold. Teams that want a structured path through the methodology before rolling it out internally can start with the FX hedging course in the Corphedge Academy. Book a walkthrough of the platform's use cases to see how the revaluation and backtesting pieces fit your current reporting cycle.
Sources
- Academic paper on properties of historical simulation and filtered historical simulation (Journal of Banking & Finance)
- Value-at-risk (VaR) — Investopedia
FAQ
How do you calculate historical VaR?
Gather a historical return series (commonly 250 to 500 trading days), apply each day's returns to your current positions to generate a simulated P&L vector, sort that vector, and read off the loss at your chosen percentile, interpolating if the rank falls between two points.
What is the difference between historical VaR and parametric VaR?
Historical VaR uses actual past returns with no distributional assumption, which lets it capture fat tails and option convexity through full revaluation. Parametric VaR estimates volatility and correlation, assumes a normal distribution, and calculates faster but tends to understate extreme currency moves.
What does a 95% VaR mean?
A 95% VaR is the loss level you'd expect to exceed on only 5% of trading days, based on the historical or modeled return distribution. It is not the worst-case loss. It's a threshold with a stated confidence level, which is why Expected Shortfall and scenario testing belong alongside it.
What are the three types of VaR?
The three main approaches are historical simulation, parametric (variance-covariance) VaR, and Monte Carlo VaR. Historical simulation replays actual past returns, parametric VaR relies on a statistical distribution, and Monte Carlo generates simulated price paths from a specified model.