

Cash Flow at Risk (CFaR) is the maximum cash shortfall a company can expect over a chosen horizon at a stated confidence level. That single number tells a treasurer whether the company's committed undrawn credit lines can absorb a bad month without triggering a covenant breach or an emergency draw.
The immediate action is comparison, not calculation. Once you have a CFaR figure, hold it against your available headroom.
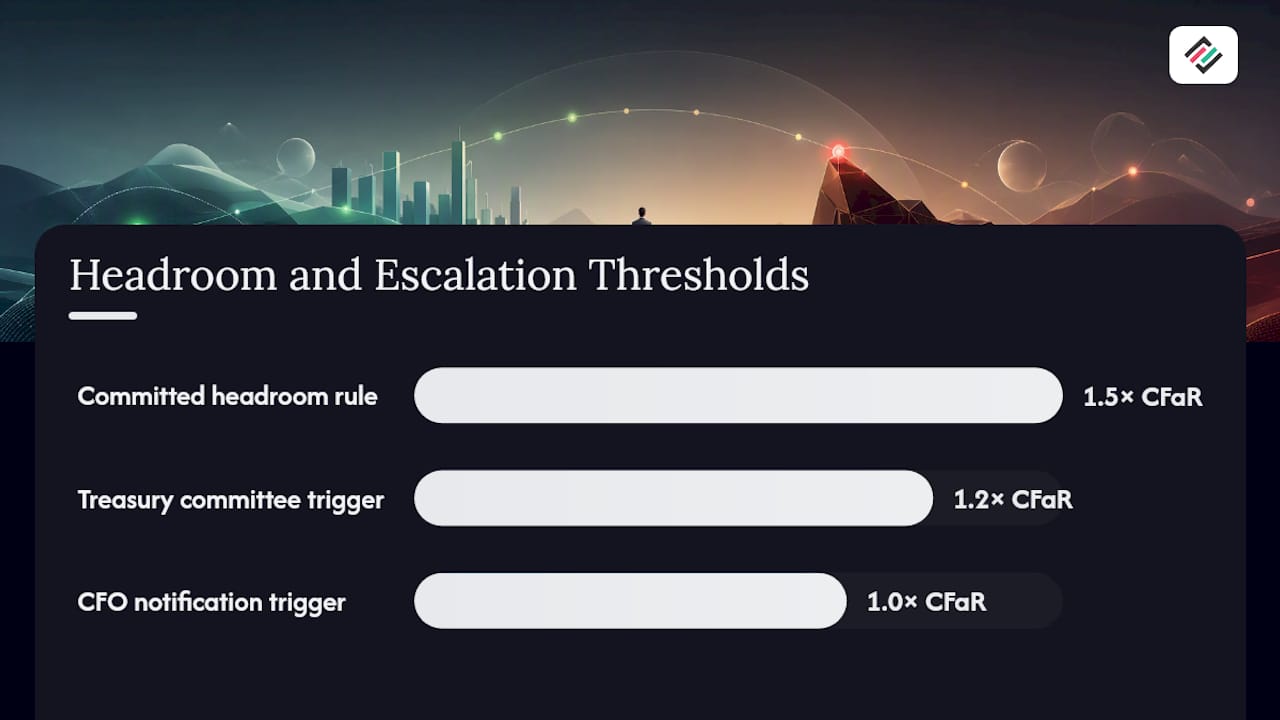
- If committed undrawn credit is at least 1.5 times your 4 week 95% CFaR, you likely have adequate buffer, following the practitioner guidance on headroom rules.
- If it isn't, you need to either shrink the exposure, extend a facility, or hold more cash before the next reporting cycle.
Key Takeaways
CFaR quantifies the maximum expected cash shortfall at a given confidence level, and it only protects a company when paired with a headroom rule and monitored continuously.
| Point | Details |
|---|---|
| CFaR defines your buffer target | A 4 week 95% CFaR of £2.47M means holding committed undrawn credit at 1.5 times that figure. |
| Method depends on data maturity | Use the parametric formula for fast monitoring; move to exposure-based regression once you have historical data to size hedges. |
| CFaR and EaR can conflict | A hedge that lowers CFaR can raise earnings volatility, so treasurers need a risk-target strategy balancing both. |
| Expected shortfall covers the blind spot | Pair CFaR with expected shortfall to see how severe losses get beyond the threshold, not just whether it's breached. |
| Corphedge operationalizes the process | Its exposure mapping and VaR based hedging tools turn CFaR from a quarterly report into continuously monitored positions. |
Table of Contents
- What Cash Flow at Risk Measures and Why Treasury Teams Rely on It
- Three Ways to Calculate Cash Flow at Risk
- CFaR Versus Earnings at Risk: Why Treasury and the CFO See Different Risks
- Building a CFaR Process: Data, Headroom Rules, and Governance
- A Worked Example: Calculating 4 Week 95% CFaR
- Where CFaR Falls Short and How to Shore It Up
- What the CFaR Playbook Gets Wrong in Practice
- How Corphedge Turns CFaR From a Report Into a Daily Habit
- Sources
- FAQ
What Cash Flow at Risk Measures and Why Treasury Teams Rely on It
CFaR is the cash-flow equivalent of Value at Risk. Where VaR asks how much portfolio value could drop, CFaR asks how much operating cash could fall short of forecast, and it quantifies that shortfall at a chosen confidence level over a defined horizon, a framing laid out in the original treatment of CFaR as a financial planning tool00358-5). The distinction matters because cash is what pays payroll and suppliers. Earnings on a P&L statement can look fine while cash is tight, especially with long receivables cycles or seasonal working capital swings.
Corporates typically run CFaR across three horizons, each serving a different audience:
- 4 week horizon for near-term liquidity monitoring by the treasury desk.
- 13 week horizon for rolling cash forecasts reviewed by finance leadership.
- 12 month horizon for board-level liquidity planning and covenant stress testing.
Confidence levels usually sit at 95% or 99%, with the higher bar used when a company is covenant-sensitive or operating with thin cash reserves. Treasury teams monitor CFaR weekly or monthly; boards typically see it quarterly alongside covenant headroom reports.
Three Ways to Calculate Cash Flow at Risk
Method choice depends on how much historical data you have and how material the exposure is. Here's how the three main approaches stack up.
| Method | Data required | Best suited for |
|---|---|---|
| Parametric formula | Historical cash flow volatility (σ) | Fast, recurring monitoring with stable exposures |
| Monte Carlo simulation | Distributional assumptions for each risk driver | Complex portfolios with multiple correlated exposures |
| Exposure-based regression | Historical cash flows plus macro/market variables | Companies wanting to size hedges against specific drivers |
The parametric formula, CFaR = Z × σ_cash × √t, is the workhorse for short-horizon monitoring. Z is the confidence multiplier (1.645 for 95%, 2.33 for 99%), σ_cash is the standard deviation of your cash flow over your base period, and √t scales that volatility to your chosen horizon, a formulation detailed in Phlo Systems' practical guide to CFaR. It's fast to compute and easy to explain to a board, but it assumes cash flow shocks are roughly normally distributed, which breaks down during genuine tail events.
Monte Carlo simulation handles that weakness by generating thousands of scenarios from specified distributions, useful when you have several correlated risk factors (FX, commodity prices, interest rates) hitting cash flow at once. It needs more infrastructure and more modeling judgment than the parametric approach.
Exposure-based CFaR takes a different route entirely: it regresses historical cash flow against macro and market variables to estimate exposure coefficients, an approach detailed in Andrén and colleagues' work on exposure-based CFaR for industrial companies. That regression output tells you how much a 1% move in, say, EUR/GBP actually moves your cash flow, which makes it the natural base for sizing a hedge rather than guessing at a percentage.
Pro Tip: Start with the parametric formula for your first CFaR report. It's defensible, fast, and gives your committee a number to react to while you build the historical data needed for exposure-based regression.
CFaR Versus Earnings at Risk: Why Treasury and the CFO See Different Risks
Earnings at Risk (EaR) measures the maximum expected shortfall in reported earnings over a horizon, the same logic as CFaR but applied to the income statement instead of the cash account. The two frequently pull in opposite directions, which is exactly why boards need both.
- A hedge that reduces FX cash flow volatility (lowering CFaR) can introduce hedge accounting mismatches or realized losses on the P&L, pushing EaR up.
- Fixed percentage hedging policies, applied uniformly regardless of underlying exposure, often satisfy neither objective well, according to the Association of Corporate Treasurers' analysis of hedging policy design.
- A risk-target strategy, one that sets an explicit tolerance for both CFaR and EaR rather than hedging a flat percentage of exposure, tends to align liquidity protection with earnings stability more consistently.
Boards care about this trade-off because a treasury team optimizing purely for cash resilience can quietly create earnings volatility the CFO didn't sign off on. Reviewing FX exposure types and their mitigation paths alongside your CFaR number helps surface where that conflict is likely to show up. Expected shortfall and debt-capacity-conditioned stress tests fill the remaining gap: they tell you not just whether you'll breach a threshold, but how bad it gets if you do.
Building a CFaR Process: Data, Headroom Rules, and Governance
A defensible CFaR number depends on clean inputs more than a clever formula. Most implementation failures trace back to data, not math.
- Pull transaction-level FX exposure, not just net position summaries, along with receivables, payables, and any margin call obligations tied to hedge positions.
- Confirm committed facility amounts and covenant terms directly from credit agreements, since informal or stale facility data is a common source of false headroom comfort.
- Set a headroom rule such as committed undrawn credit at 1.5 times your 4 week 95% CFaR, then monitor weekly against that threshold, per the headroom benchmarks used in commodity trading practice.
- Define escalation triggers in advance, for example a report to the treasury committee when headroom drops below 1.2 times CFaR, and a CFO notification below 1.0.
- Standardize the reporting template so the treasury committee and the board see the same number, calculated the same way, every cycle. A risk reporting checklist helps keep that format consistent across quarters.
The most common pitfall is running CFaR out of a spreadsheet maintained by one analyst, with no link back to accounting or earnings impact. When that person leaves, the model usually leaves with them.
Pro Tip: Build your escalation triggers into the monitoring dashboard itself, not just the policy document. A rule nobody sees until quarter-end isn't a control, it's a postmortem.
A Worked Example: Calculating 4 Week 95% CFaR
Say your treasury team has tracked cash flow volatility and found σ_cash equals £1.5M over a 4 week base period.
- CFaR = 1.645 × £1.5M × √1 = £2.47M
Now check it against headroom. If committed undrawn credit sits at £3M, your ratio is roughly 1.2 times CFaR, below the 1.5 times benchmark commonly recommended for adequate buffer. That's a signal to either negotiate additional facility headroom or trim the underlying exposure before next quarter.
To test robustness, double σ_cash to £3M and rerun the formula: CFaR jumps to £4.94M. If your facility can't cover that stressed case, you're one volatile month away from a liquidity conversation you didn't plan for.
Where CFaR Falls Short and How to Shore It Up
CFaR reports a single number at a single confidence level, which is exactly its weakness.
- Tail severity is invisible in a standard CFaR figure. Two companies with identical £2.5M CFaR can have very different worst-case outcomes beyond that threshold.
- Data gaps, especially in transaction-level exposure or informal facility terms, quietly bias the number without anyone noticing.
- CFaR ignores earnings and accounting side effects entirely, so a hedge that improves it can still create a P&L problem, as noted in Bloomberg's analysis of CFaR and EaR limitations.
Expected shortfall addresses the tail-severity gap directly by averaging losses beyond the CFaR threshold rather than stopping at it, a property that makes it a more coherent risk measure for corporate capital adequacy decisions.
What the CFaR Playbook Gets Wrong in Practice
Most guides on this topic treat CFaR as a math problem. It isn't. The formula takes five minutes; getting the underlying exposure data clean enough to trust it takes months, and that's the part conventional advice skips past.

The bigger blind spot is treating CFaR and EaR as competing metrics instead of a single governance decision. Treasury teams that hedge purely to minimize CFaR routinely hand the CFO an earnings volatility problem nobody budgeted for. A risk-target strategy, one that sets explicit tolerances for both, is the more defensible approach, but it requires treasury and finance leadership to agree on trade-offs before a crisis forces the conversation.
If there's one place to start, it's the headroom rule, not the formula. The number matters less than the habit of checking it against something real.
— Bartas
How Corphedge Turns CFaR From a Report Into a Daily Habit
Running the process described above by hand, transaction-level exposure pulls, regression models, headroom monitoring, escalation alerts, is where most treasury teams stall out. Corphedge is built around exactly that gap.

The platform's exposure mapping tools give you live currency position tracking instead of a weekly spreadsheet reconciliation, which is the data foundation an exposure-based CFaR model actually needs. Its Value at Risk based hedging methodology applies the same statistical logic covered here, so your hedge sizing ties directly to your CFaR and EaR targets rather than an arbitrary percentage. Automated notifications flag when headroom drops toward your escalation trigger, and reporting templates are built for the treasury committee and CFO review cycle described in the checklist above. Corphedge is also expanding its platform to Poland and Sweden, adding to its current coverage for internationally active companies managing multi-currency exposure. If your team is still calculating CFaR in a spreadsheet that lives on one analyst's laptop, start a Corphedge trial and see what exposure-based monitoring looks like when it runs continuously instead of once a quarter.
Sources
- A risk target strategy versus percentage hedging policies | The Association of Corporate Treasurers
- Exposure-Based Cash-Flow-at-Risk: An Alternative to VaR for Industrial Companies
- 2007 Enterprise Risk Management Symposium: Are At-Risk Measures Useful Measures of Risk at the Corporate Level?
- Cash Flow at Risk (CFAR) for commodity trading firms: a practical guide — Phlo Systems Blog
FAQ
What Is a Cash Flow Risk?
Cash flow risk is the possibility that a company's actual cash inflows and outflows deviate unfavorably from forecast, driven by factors like FX rates, customer payment delays, or commodity price swings. CFaR quantifies that risk as a specific dollar or pound figure at a chosen confidence level.
What Are the Three Types of Cash Flow?
Businesses generally track cash flow from operating activities, investing activities, and financing activities. CFaR analysis typically focuses on operating cash flow, since that's the component most exposed to short-term market and demand volatility.
What Are the Basic Rules of Cash Flow Management?
Sound cash flow management rests on a few consistent principles: forecast regularly and compare against actuals, maintain committed credit headroom above your calculated CFaR, monitor receivables and payables timing closely, and escalate deviations before they become emergencies rather than after.
How Do You Explain Cash Flow at Risk Simply?
It works like a weather forecast for your bank balance: not a certainty, but a bounded warning you can plan around.
How Often Should a Company Recalculate CFaR?
Treasury teams typically recalculate CFaR weekly or monthly for short horizons like 4 weeks, and quarterly for 12 month board reporting. Platforms like Corphedge that track exposure continuously let this monitoring happen automatically rather than as a periodic manual exercise.